Disneyland Wait Times for September 2022
The Happiest Place on Earth will get even happier soon. On September 2nd, Haunted Mansion Holiday opens, signifying the start of the Halloween season.
Even though Disneyland fanatics will flock to the parks, attendance will still go down.

Photo: DIsneyland
September has historically been among the least popular tourism months of the year. Even the surge in Halloween events hasn’t undone that trend.
Similarly, other annual vacation patterns hold as well. For example, summer crowds max out in July but then diminish in size in August.
Photo: Disneyland
We can track this behavior by talking about the Disneyland Resort wait times for the month.
Disneyland Resort
Disneyland Resort consists of two theme parks and a shopping district. However, the more popular location BY FAR is Disneyland Park.
Photo: Disneyland
Even when crowds diminish in size, Southern California locals still visit. It’s a way of life for many Disneyland fanatics.
So, this month’s wait times will reflect a change in the school status of potential vacationers.
Image: Disney
With kids back in school, tourist numbers dwindle in August and especially September. But Disneyland devotees should negate some of that behavior.
Did they? Let’s look at the average waits at Disneyland Park.
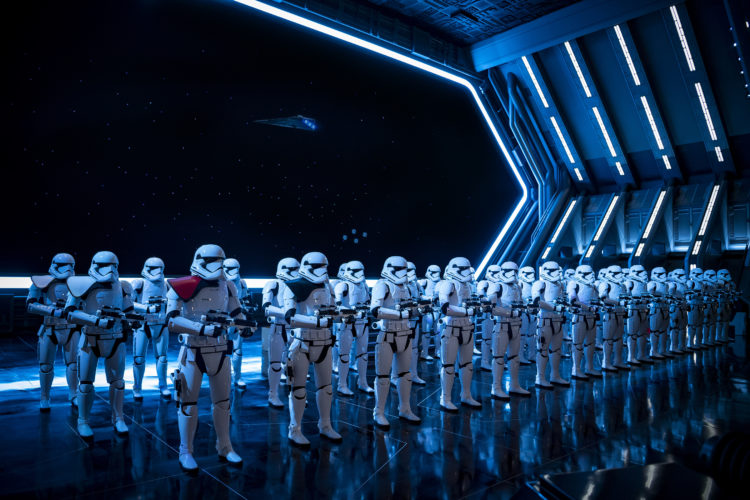
Photo: Matt Stroshane
The most popular attraction at this park remains Star Wars: Rise of the Resistance.
Since the E-ticket ride opened, it has attracted the largest crowds at Disneyland, a fact that remained true in August.
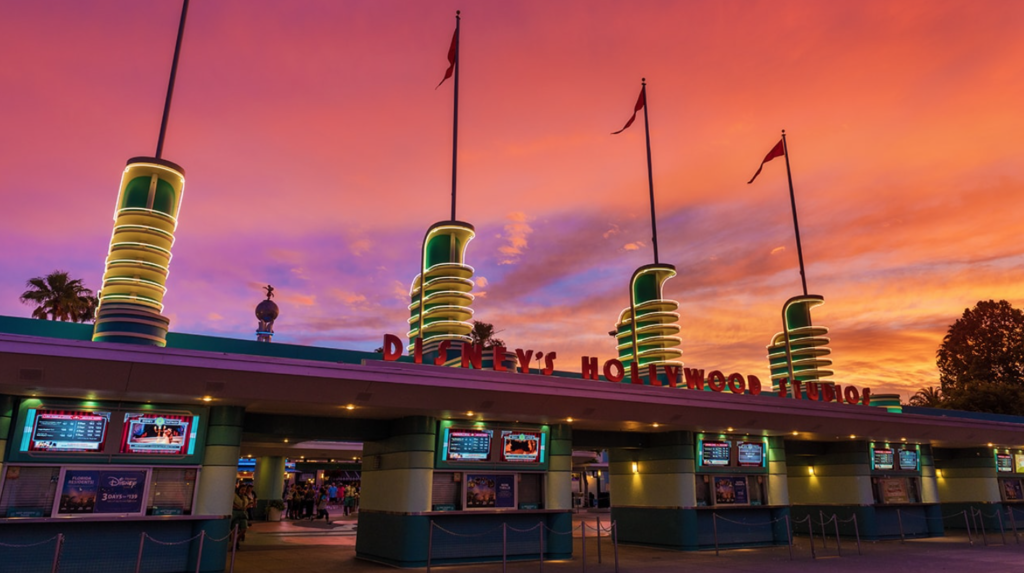
Photo: Disney
For the past month, guests waited a modest 76 minutes to experience Rise of the Resistance, a number that makes Disney’s Hollywood Studios fans envious.
The ride rarely falls beneath 90 minutes in Orlando and often crosses 120 minutes.
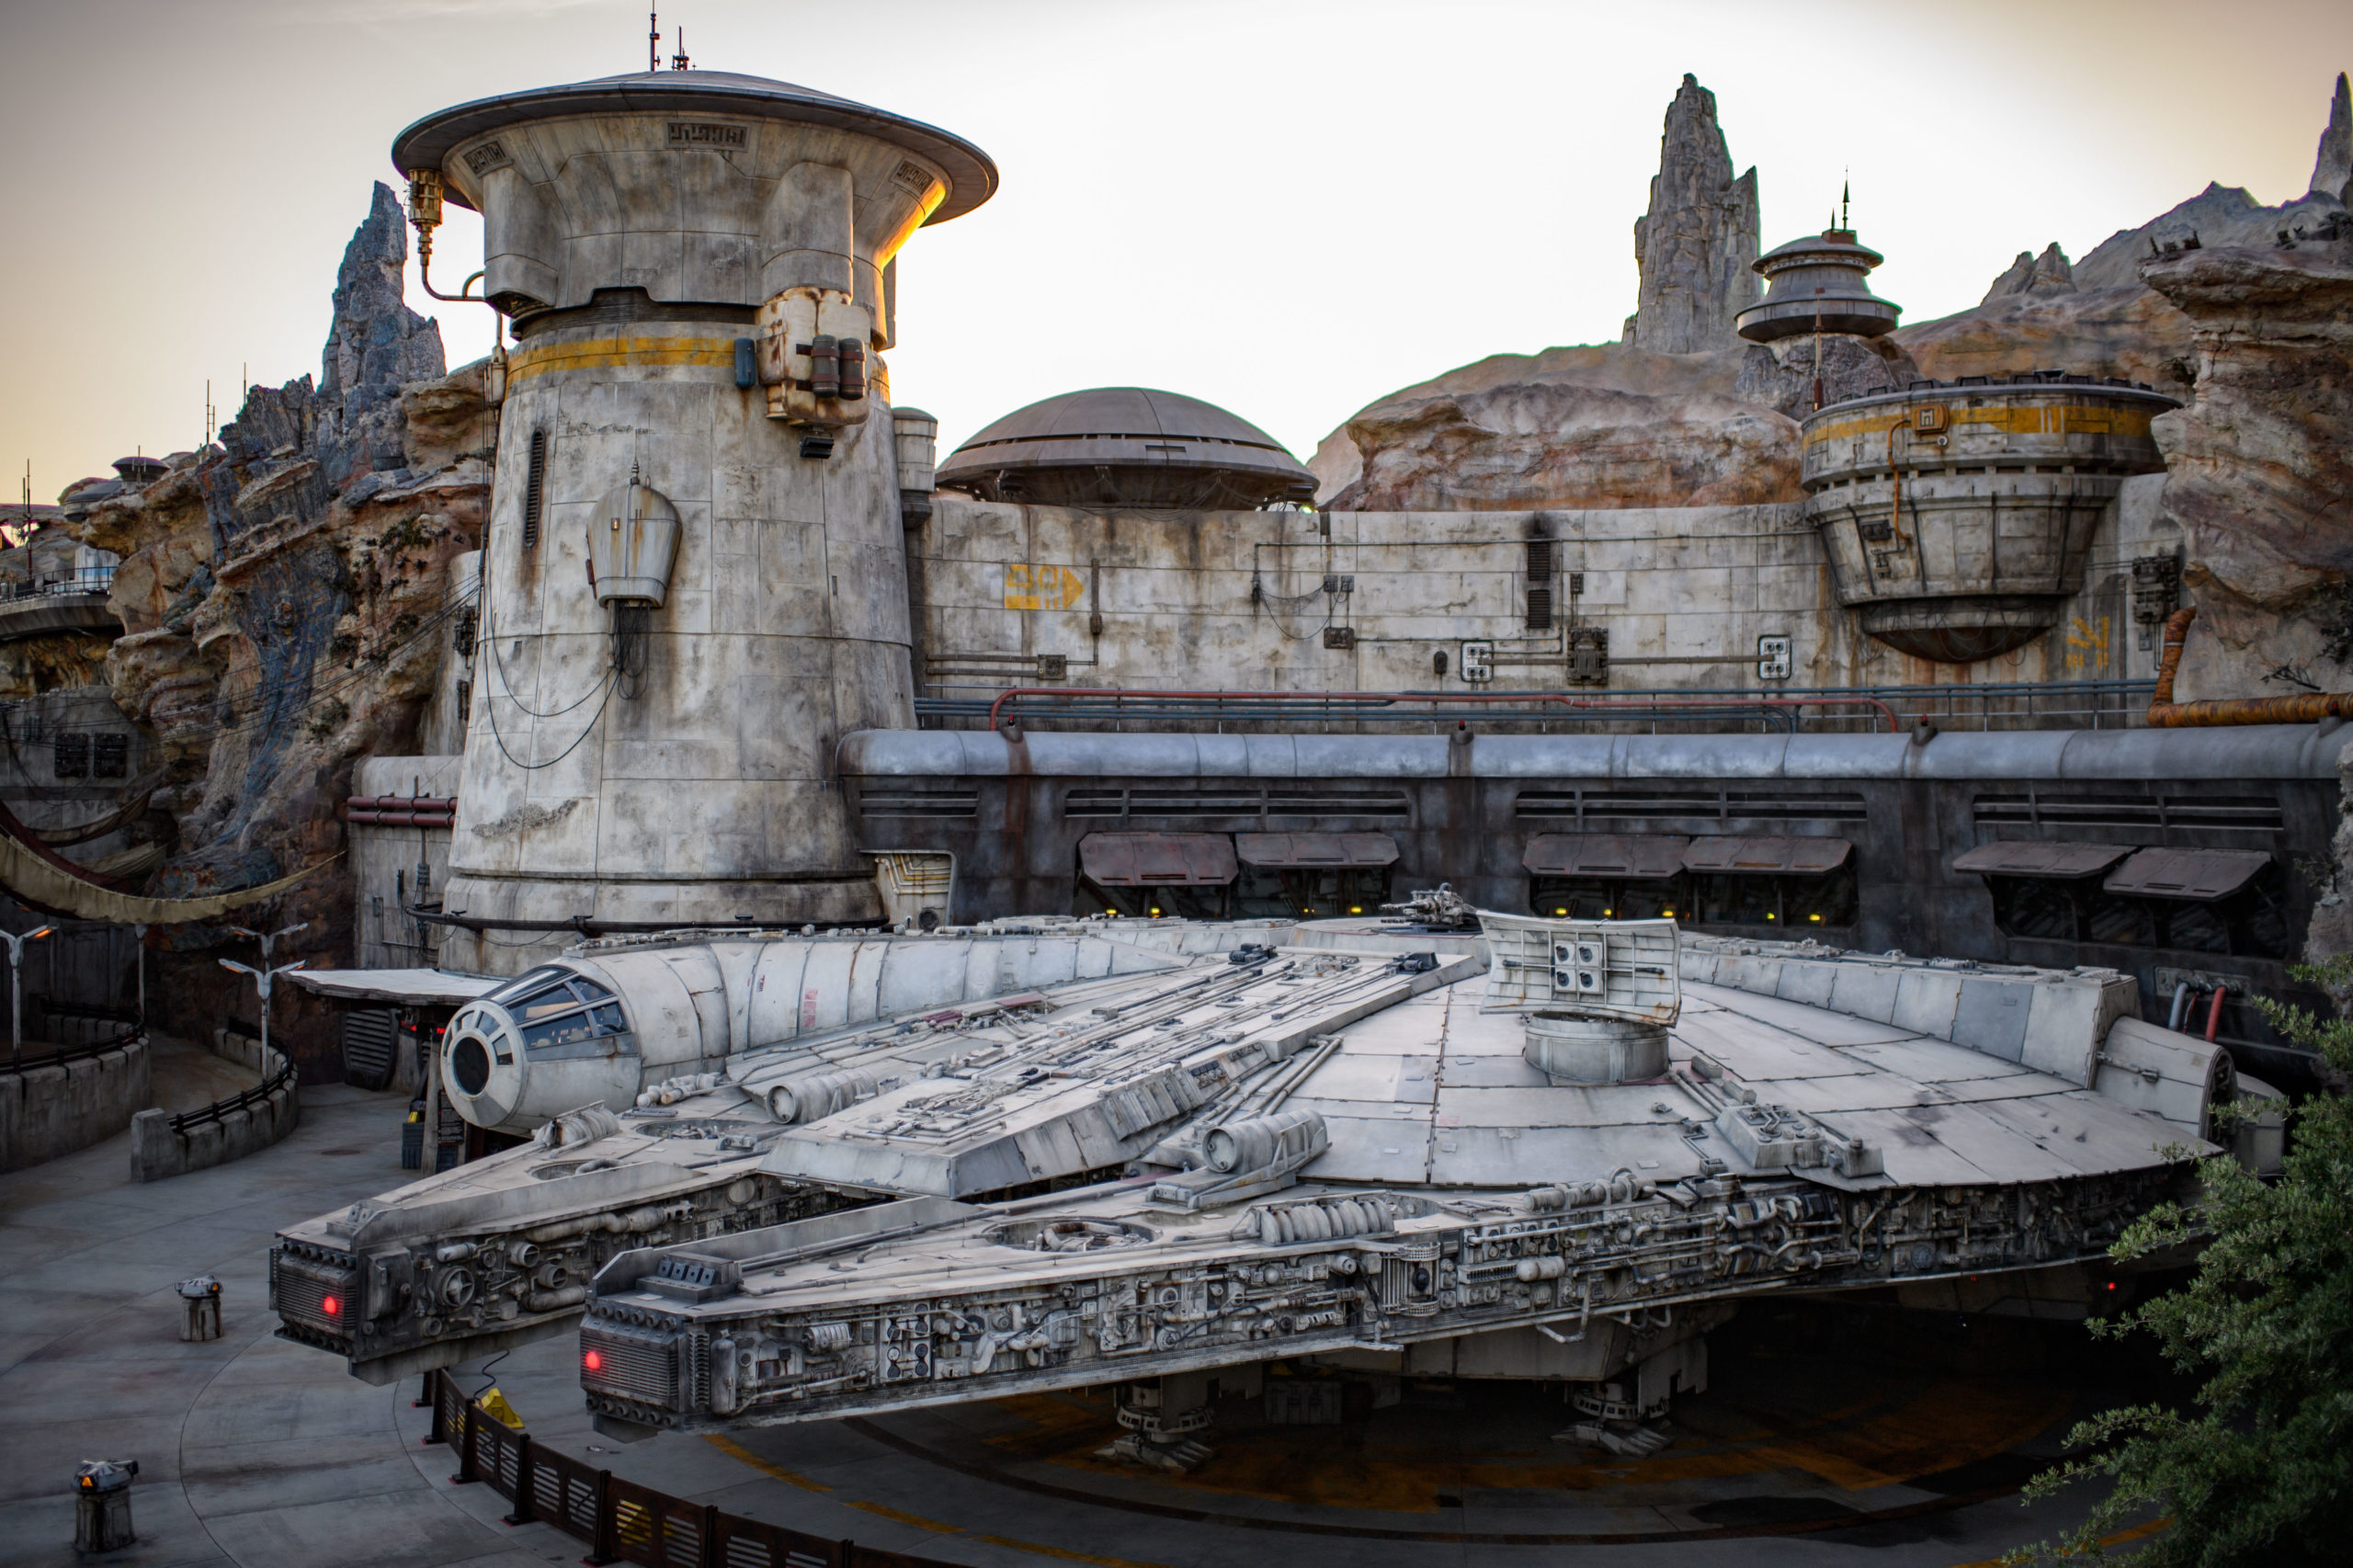
Photo: Richard Harbaugh
Still, the Disneyland wait has only decreased by four minutes, which isn’t as much as I had expected.
Average Waits at Disneyland Park
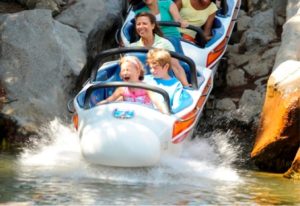
Photo: Disney
Let’s check the other rides at the park to determine whether this was an anomaly:
- Matterhorn Bobsleds – 62 minutes, up 2
- Splash Mountain – 57 minutes, down 8
- Space Mountain – 53 minutes, down 12
- Indiana Jones Adventure – 51 minutes, down 9
- Millennium Falcon: Smugglers Run – 45 minutes, down 12
- Star Tours – The Adventures Continue! – 45 minutes, up 6
- Finding Nemo Submarine Voyage – 42 minutes, down 9
- Jungle Cruise – 41 minutes, up 4
- Big Thunder Mountain Railroad – 40 minutes, down 5
- Pirates of the Caribbean – 40 minutes, down 1
- Peter Pan’s Flight – 39 minutes, up 1
- Haunted Mansion – 38 minutes, down 2
- Buzz Lightyear Astro Blasters – 37 minutes, down 4
- Alice in Wonderland – 36 minutes, down 1
- Dumbo the Flying Elephant – 35 minutes, down 1
- Storybook Land Canal Boats – 30 minutes, no change
- Astro Orbiter – 29 minutes, down 5
- Autopia – 30 minutes, down 5
- Toad’s Wild Ride – 25 minutes, no change
- Snow White’s Enchanted Wish – 24 minutes, no change
- It’s a Small World – 20 minutes, up 1
- Pinocchio’s Daring Journey – 19 minutes, up 1
- Casey Jr. Circus Train – 17 minutes, down 3
- The Many Adventures of the Winnie the Pooh – 16 minutes, no change
- King Arthur Carrousel – 15 minutes, up 1
- Mad Tea Party – 15 minutes, no change
- Disneyland Railroad – 13 minutes, down 10
- Disneyland Monorail – 5 minutes, down 4
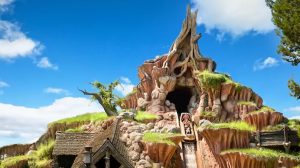
Photo: Disneyland
Overall, guests waited for an average of 34 minutes for Disneyland attractions. That’s a modest decline of three minutes.
So, crowds went down, but I wouldn’t describe the drop as significant. Did that trend hold at Disney California Adventure? Well…
Photo: DIsneyland
Disney California Adventure
As previously discussed, this park features two alphas, one of which has been around for ages.
A decade after its debut, Radiator Springs Racers still requires the longest wait at the park. It averaged 104 minutes for the past month.
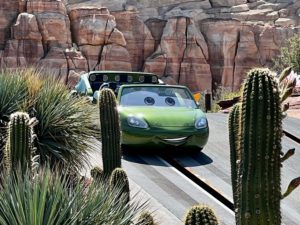
Folks, that’s an increase of six minutes from last time. I will add the context that the attraction experienced some mechanical hiccups last month. They may play a factor.
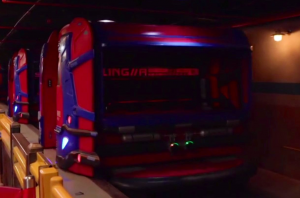
The newest ride at the park, WEBSLINGERS: A Spider-Man Adventure, has watched its crowds diminish substantially in 2022.
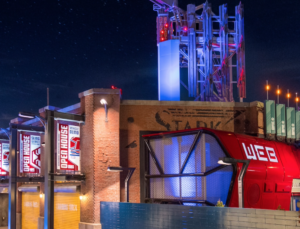
Photo: Disneyland
For the past month, guests waited for an average of 50 minutes in line here, a drop of 18 minutes from last time.
Remarkably, WEBSLINGERS only claimed the fourth-longest wait, and it’s the one in second place that cracks me up.
Source: DLP Report Podcast
The Red Car Trolley returned after an extended absence. Guests obviously missed it dearly, as they waited an average of 88 minutes to ride it.
Look, I like trolley cars as much as the next person, but I’d never wait an hour and a half to ride one. Different strokes, I guess…
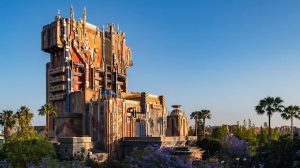
Photo: Disneyland
The other surprisingly long wait this past month occurred at Guardians of the Galaxy – Mission: BREAKOUT!
Guests waited an average of 75 minutes, a 20-minute increase. I’m not going to lie. So much of this month’s park data strikes me as odd, bordering on inexplicable.
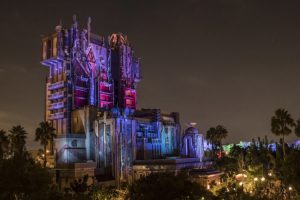
Photo: Disneyland
Wait Times at Disney California Adventure
Here are the other wait times at Disney California Adventure, which I hope make more sense:
- Toy Story Mania! – 50 minutes, down 10
- Grizzly River Run – 49 minutes, down 14
- Soarin’ Around the World – 46 minutes, down 11
- The Incredicoaster – 45 minutes, up two
- Goofy’s Sky School – 42 minutes, down 3
- Monsters, Inc. Mike & Sulley to the Rescue! – 39 minutes, down 5
- Pixar Pal-A-Round – 33 minutes, down 4
- Inside Out Emotional Whirlwind – 25 minutes, up 2
- Mater’s Junkyard Jamboree – 17 minutes, no change
- Silly Symphony Swings – 15 minutes, down 5
- The Little Mermaid ~ Ariel’s Undersea Adventure – 15 minutes, down 3
- Jumpin’ Jellyfish – 14 minutes, down 1
- Golden Zephyr – 10 minutes, down 1
- Jessie’s Critter Carousel – 5 minutes down 2
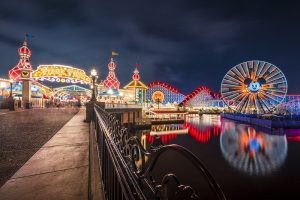
Photo: Disney
Overall, guests waited an average of 37 minutes, two minutes less than last month.
So, Disneyland Resort crowds did grow smaller in size…but not by a significant amount. Color me surprised.
Thanks for visiting MickeyBlog.com! Want to go to Disney? For a FREE quote on your next Disney vacation, please fill out the form below and one of the agents from MickeyTravels, a Platinum level Authorized Disney Vacation Planner, will be in touch soon!
Feature Photo: Disneyland