Walt Disney World Wait Times for Third Week of August 2022
Okay, I’ve hemmed and hawed about when Walt Disney World crowds should diminish.
Now, I’m ready to state definitively that this phenomenon should be occurring as we speak.
Photo: Matt Stroshane
Most parts of the United States have started school again. Since families cannot travel in droves, theme park attendance should go down. But did it?
Here are the Walt Disney World wait times for the third week of August 2022.
(David Roark, photographer)
Disney’s Animal Kingdom
Okay, I’m out on a limb here as we evaluate one of the most popular Orlando attractions.
I expect Avatar Flight of Passage to drop some from last week’s average wait of 96 minutes. And I’m happy to report that it did!
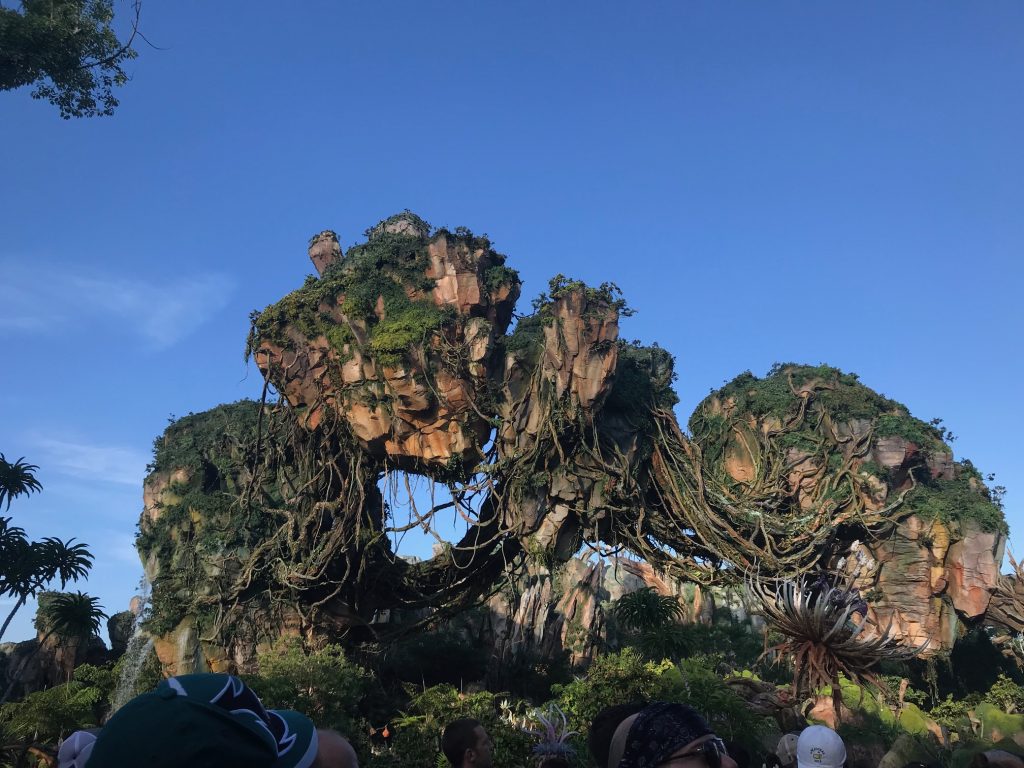
Guests waited an average of 89 minutes to experience the best of Pandora – The World of Avatar. That’s seven minutes better than last time!
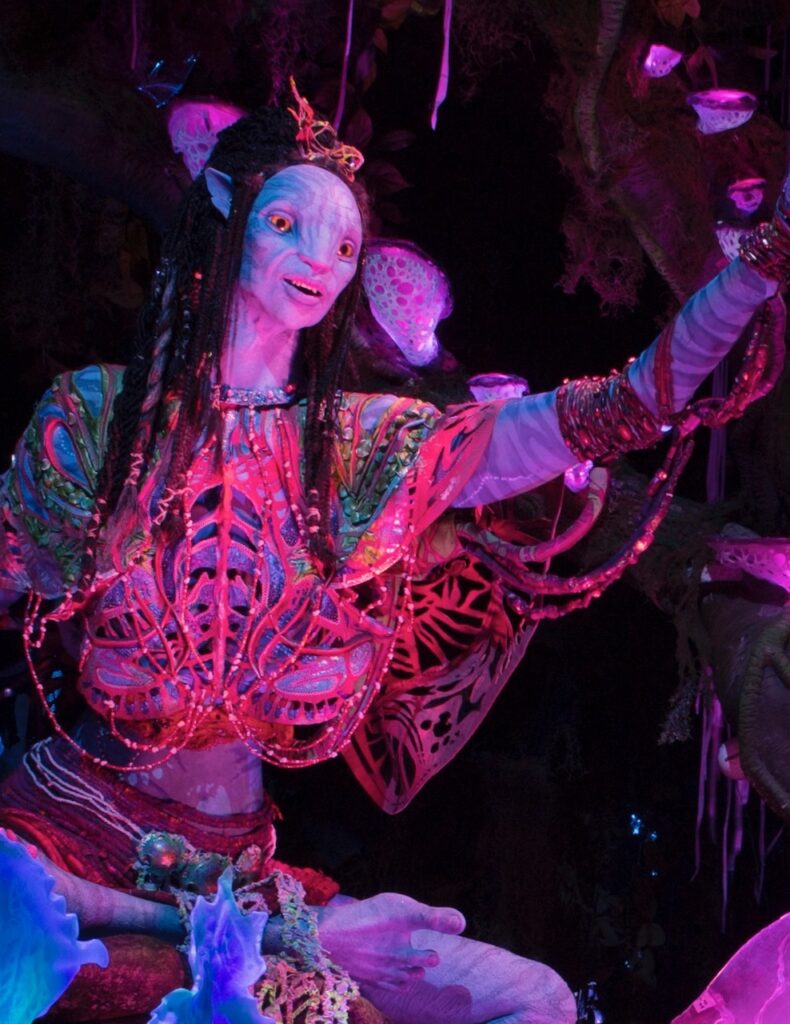
You’re probably wondering about its sister attraction, Na’vi River Journey. The other Pandora ride decreased by 10 minutes. It averaged 56 minutes for the week.
(Kent Phillips, photographer)
Another attraction, Kali River Rapids, actually increased from last time.
Guests stood in line for 52 minutes, one more minute more, which is basically just statistical noise.
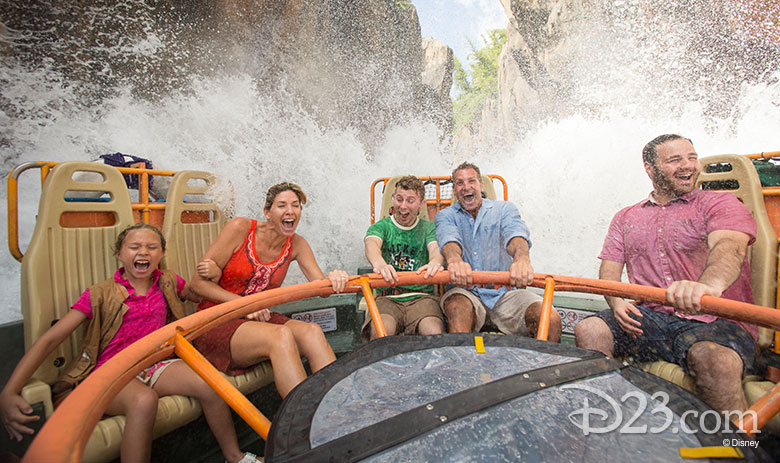
Photo: D23
Here is everything else at Animal Kingdom:
- Kilimanjaro Safaris – 45 minutes, down 5
- Adventurers Outpost – 42 minutes, down 4
- DINOSAUR – 38 minutes, down 2
- Expedition Everest – 35 minutes, down 2
- It’s Tough to Be a Bug! – 11 minutes, down 2
- TriceraTop Spin – 7 minutes, down 3
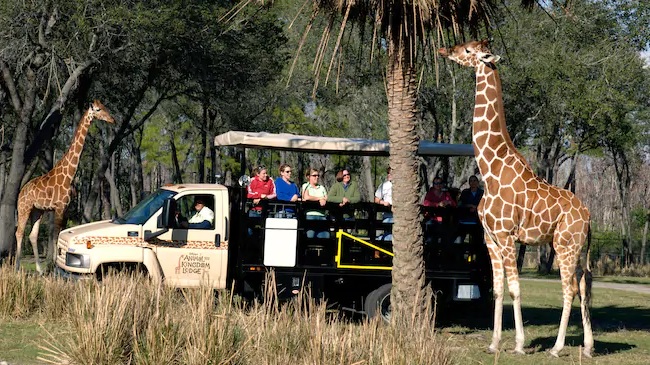
Photo: Disney
Overall, guests waited for an average of 42 minutes for Animal Kingdom attractions. That’s a three-minute drop from the previous week.
Something I’ll point out here is that this park should hover in the mid-30s during an average Disney week, especially in the off-season.
Image Credit: Disney
So, we’re still trending toward the high end, even though we’re tracking a gradual erosion of crowd sizes.
Disney’s Hollywood Studios
The one theme park that won’t be impacted much by smaller overall crowds is Hollywood Studios. People are gonna visit here no matter what.
The sustained drawing power of Star Wars: Galaxy’s Edge is staggering to track.
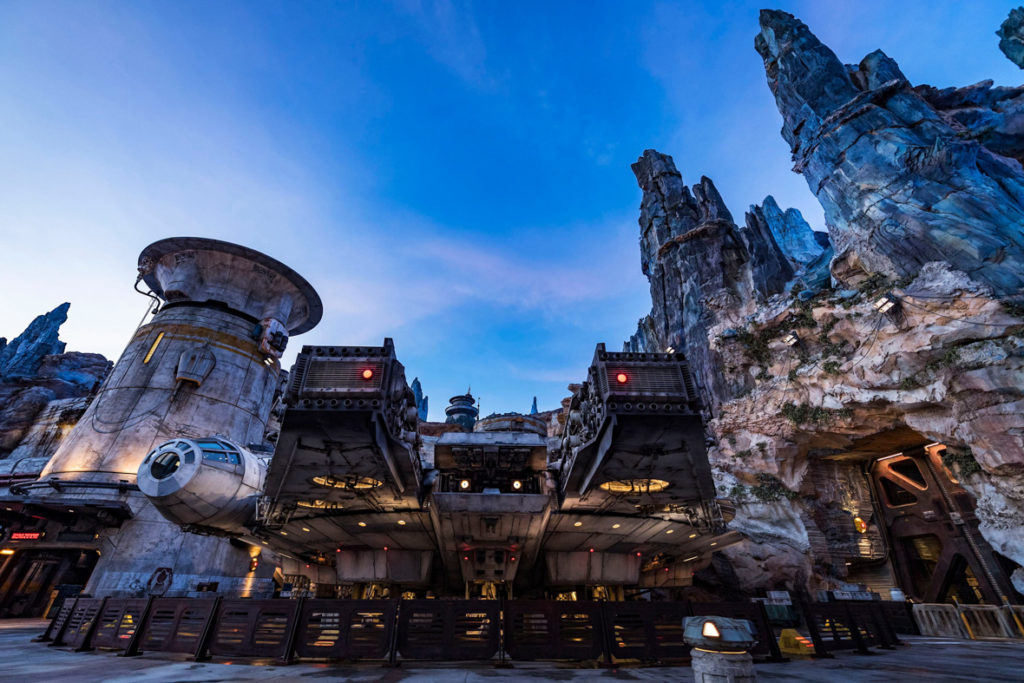
Photo: Matt Stroshane, photographer
For example, Star Wars: Rise of the Resistance averaged a wait of 107 minutes, down 14 minutes from last time.
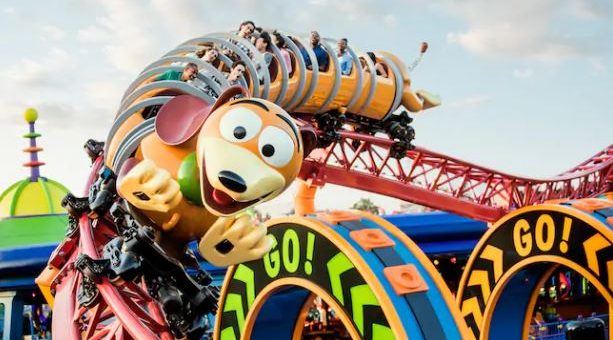
Meanwhile, Slinky Dog Dash slipped six minutes to 86 minutes. So, we’re talking about gradual improvements for rides that still require an hour and a half to experience.
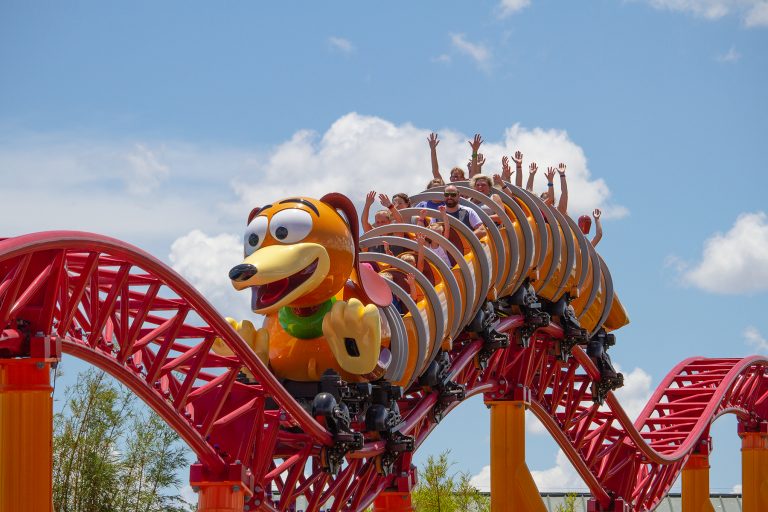
Photo: TheCoasterKings.com
Here’s everything else at Hollywood Studios:
- Millennium Falcon: Smugglers Run – 77 minutes, down 3
- Toy Story Mania! – 62 minutes, down 4
- Rock ‘n’ Roller Coaster Starring Aerosmith – 60 minutes, down 15
- Mickey & Minnie’s Runaway Railway – 59 minutes, down 5
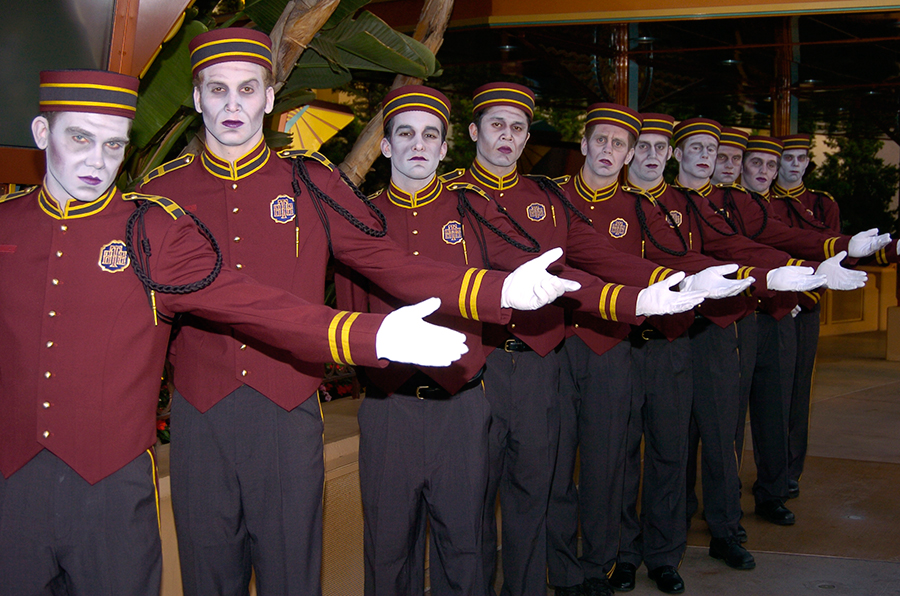
- Twilight Zone Tower of Terror – 49 minutes, down 4
- Red Carpet Dreams – 40 minutes, down 1
- Meet Sulley at Walt Disney Presents – 38 minutes, down 2
- Alien Swirling Saucers – 36 minutes, down 3
- Celebrity Spotlight – 25 minutes, no change
- Star Tours – The Adventures Continue – 20 minutes, down 7
- Lightning McQueen’s Racing Academy – 15 minutes, up 2
- Muppet*Vision 3D – 10 minutes, no change
Overall, the average Hollywood Studios attraction averaged a wait of 46 minutes, which is two minutes less than last time.
Something I’d point out is that only five – but really six – attractions required a wait of 60+ minutes. Everything else fell under 50 minutes.
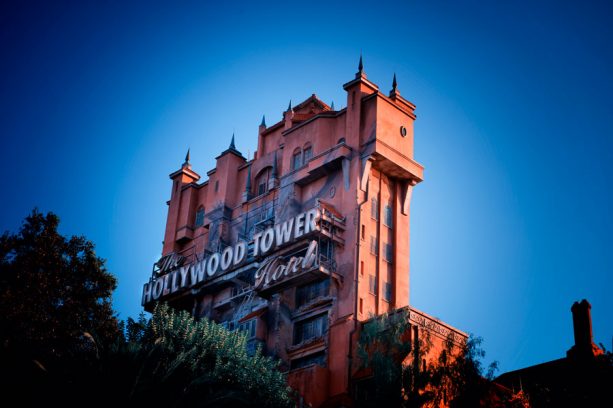
Photo: Disney
So, we are tracking some gradual improvements at the parks. They’re just subtle.
EPCOT
We have another change at the top at EPCOT. Again, the top three remain the same as last week, only in a slightly different order.
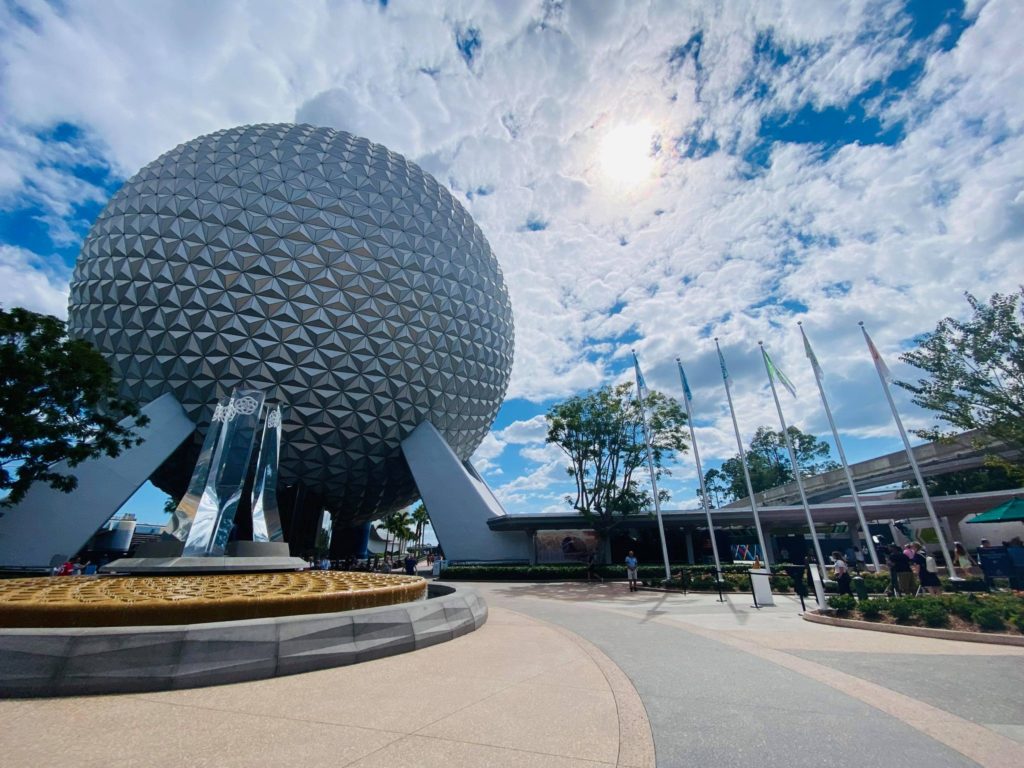
Also, you may recall that this park had experienced a market correction.
The wait times dropped enough that the average attraction required only 28 minutes in line. And I’m happy to report the situation has gotten even better!
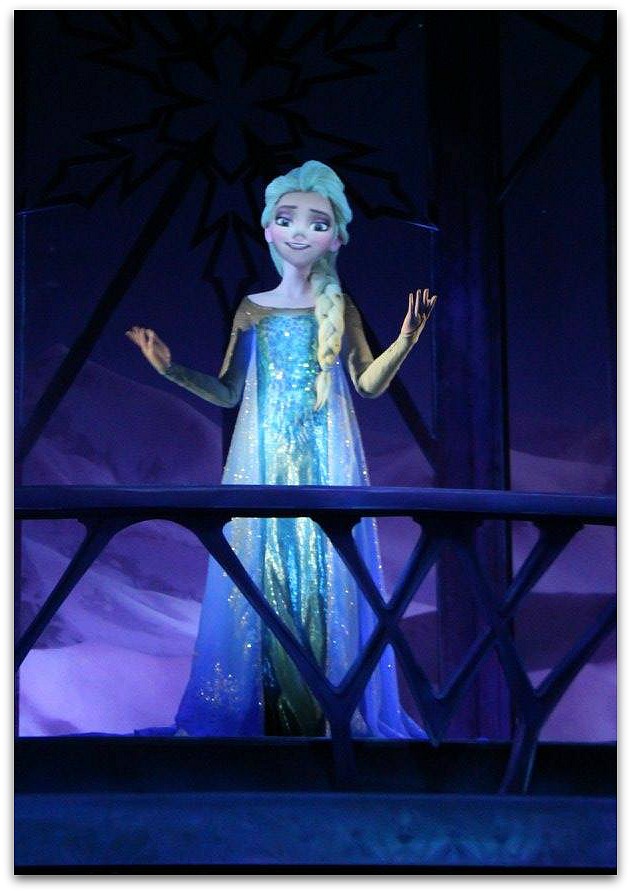
Photo: Disney
For example, Frozen Ever After averaged a wait of 66 minutes, down two minutes from last time.
Similarly, Remy’s Ratatouille Adventure required line time of 64 minutes, a drop of seven minutes week-over-week. So, it falls to second place.
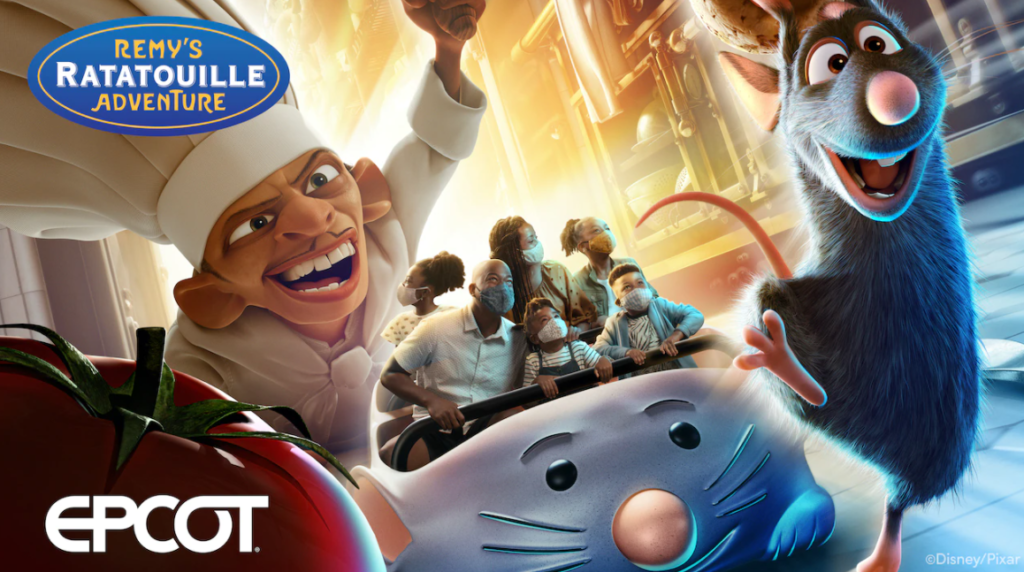
Photo: Disney
Meanwhile, Test Track came in at 63 minutes, a drop of a minute from the previous article.
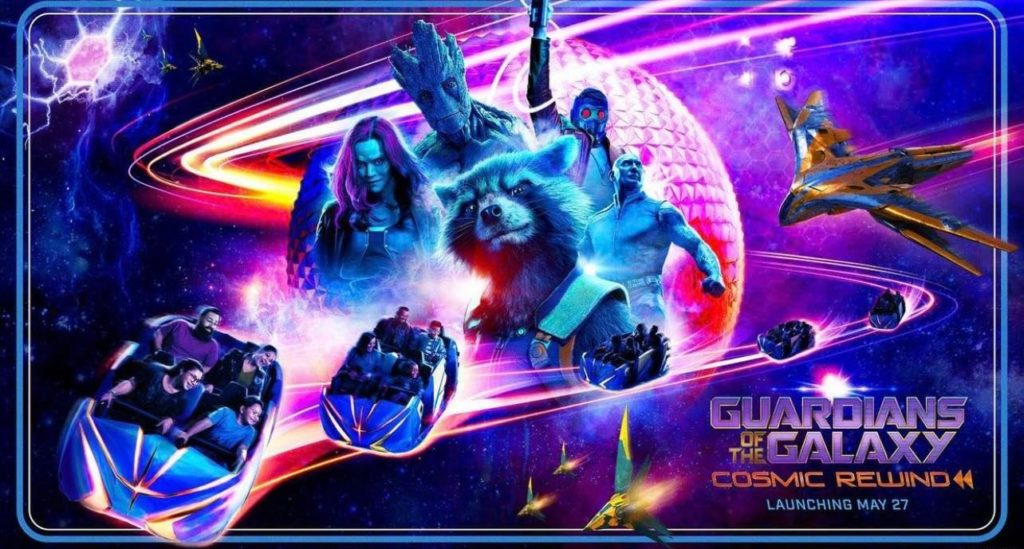
That’s three attractions with average waits of roughly 60 minutes plus Guardians of the Galaxy: Cosmic Rewind, which we’re still not tracking.
Credi
Once you’ve experienced all four of these attractions, EPCOT’s a walk in the park…literally. Here are the other wait times:
- Soarin’ Around the World – 28 minutes, down 3
- Mission: SPACE – 27 minutes, down 6
- Royal Sommerhus – 18 minutes, no change
- Living with the Land – 14 minutes, up 5
- Turtle Talk with Crush – 12 minutes, no change
- Gran Fiesta Tour Starring the Three Caballeros – 11 minutes, up 1
- Spaceship Earth – 11 minutes, no change
- Journey into Imagination with Figment – 10 minutes, up 3
- The Seas with Nemo & Friends – 10 minutes, down 4
Overall, guests only waited an average of 26 minutes, down two minutes from last time.
More importantly, every EPCOT attraction but four came with a sub-30-minute wait, which is ridiculously good.
Photo: Disney
Magic Kingdom
Okay, the trend is unmistakable. The parks were less crowded last week. We’ve got one more place to check, though.
Here are the average waits at Magic Kingdom:
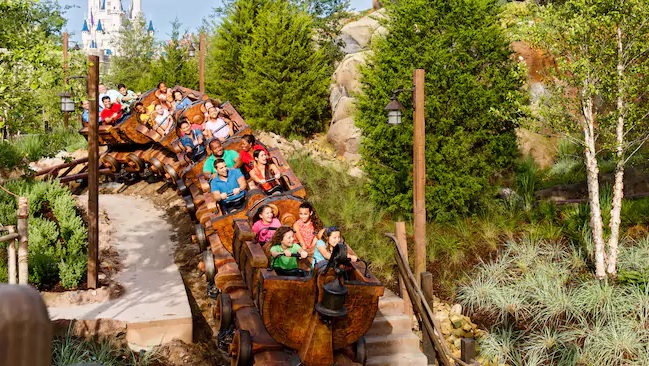
- Seven Dwarfs Mine Train – 78 minutes, up 3
- Peter Pan’s Flight – 67 minutes, down 1
- Splash Mountain – 59 minutes, down 1
- Town Square Theater – 55 minutes, up 4
- Jungle Cruise – 54 minutes, down 7
- Space Mountain – 47 minutes, down 1
- Haunted Mansion – 45 minutes, down 5
- Buzz Lightyear’s Space Ranger Spin – 42 minutes, down 2
- Big Thunder Mountain Railroad – 40 minutes, down 5
- Princess Fairytale Hall – 36 minutes, down 1
- The Many Adventures of Winnie the Pooh – 35 minutes, down 1
- Pirates of the Caribbean – 35 minutes, up 1
- Astro Orbiter – 34 minutes, down 6
- It’s a Small World – 29 minutes, down 1
- Tomorrowland Speedway – 29 minutes, down 3
- Under the Sea ~ Journey of the Little Mermaid – 25 minutes, down 1
- Magic Carpets of Aladdin – 19 minutes, down 5
- Tomorrowland Transit Authority PeopleMover – 16 minutes, no change
- The Barnstormer – 15 minutes, down 3
- Mickey’s PhilharMagic – 15 minutes, down 2
- Monsters, Inc. Laugh Floor – 14 minutes, down 1
- Mad Tea Party – 12 minutes, down 2
- Dumbo the Flying Elephant – 10 minutes, down 2
- Prince Charming Regal Carrousel – 7 minutes, down 6
- Walt Disney’s Carousel of Progress – 5 minutes, no change
- Country Bear Jamboree – 5 minutes, no change
Credit: Disney
Overall, guests waited for an average of 32 minutes for Magic Kingdom attractions. That’s down two minutes from last time.
So, yes, Walt Disney World did slow down a bit during the first three weeks of August. It’s subtle, but I assure you it’s happening!
Feature Image: Disney