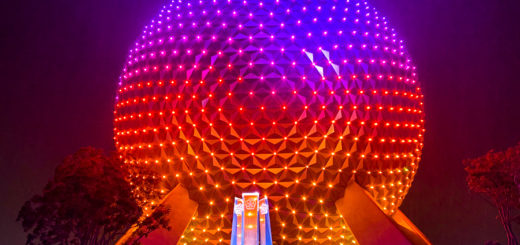
Disneyland Wait Times for July 2022
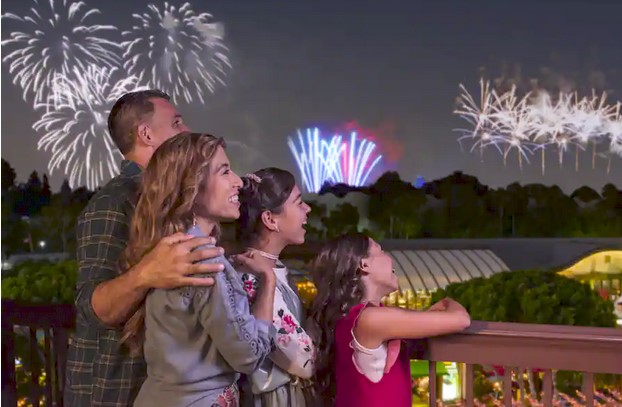
School is out in California, which should lead to longer waits at the two theme parks.
After all, a staggering percentage of Disneyland Resort’s attendance comes from the locals within the Golden State.
Credit: Disney
So, when families have more vacation days, crowds increase. It’s not rocket science.
On the plus side, Disney has turned its crowd control tactics into an art form. As such, there’s a chance we don’t track significant changes this time.
Photo: Disneyland
Here are the average Disneyland Resort wait times for the most recent month.
Disneyland Resort
Okay, I stepped in it last month after a previous cold take regarding Star Wars: Rise of the Resistance.
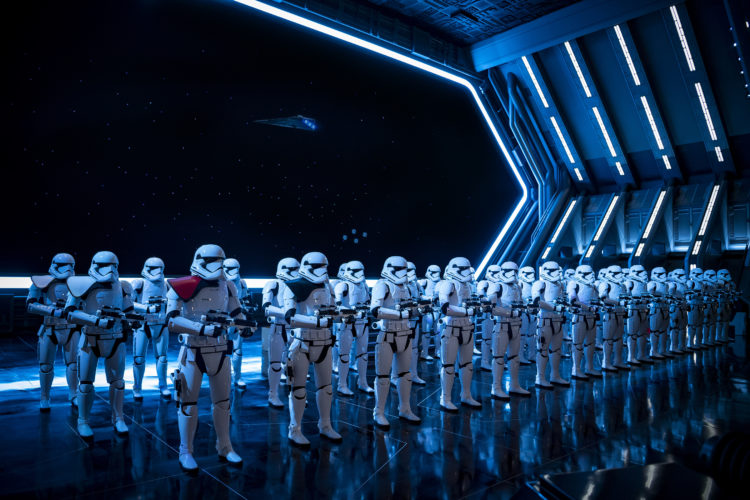
Photo: Matt Stroshane
I’d asserted that the lines at Disneyland Park never approach the duration of the ones at Disney’s Hollywood Studios.
Almost immediately afterward, Hollywood Studios lines decreased as park officials enhanced throughput.
Photo: Disney
That park has careened wildly over the past month but has averaged an overall wait of 125 minutes.
So, Disneyland fans should feel pretty good about the 85-minute average for Rise of the Resistance this month.
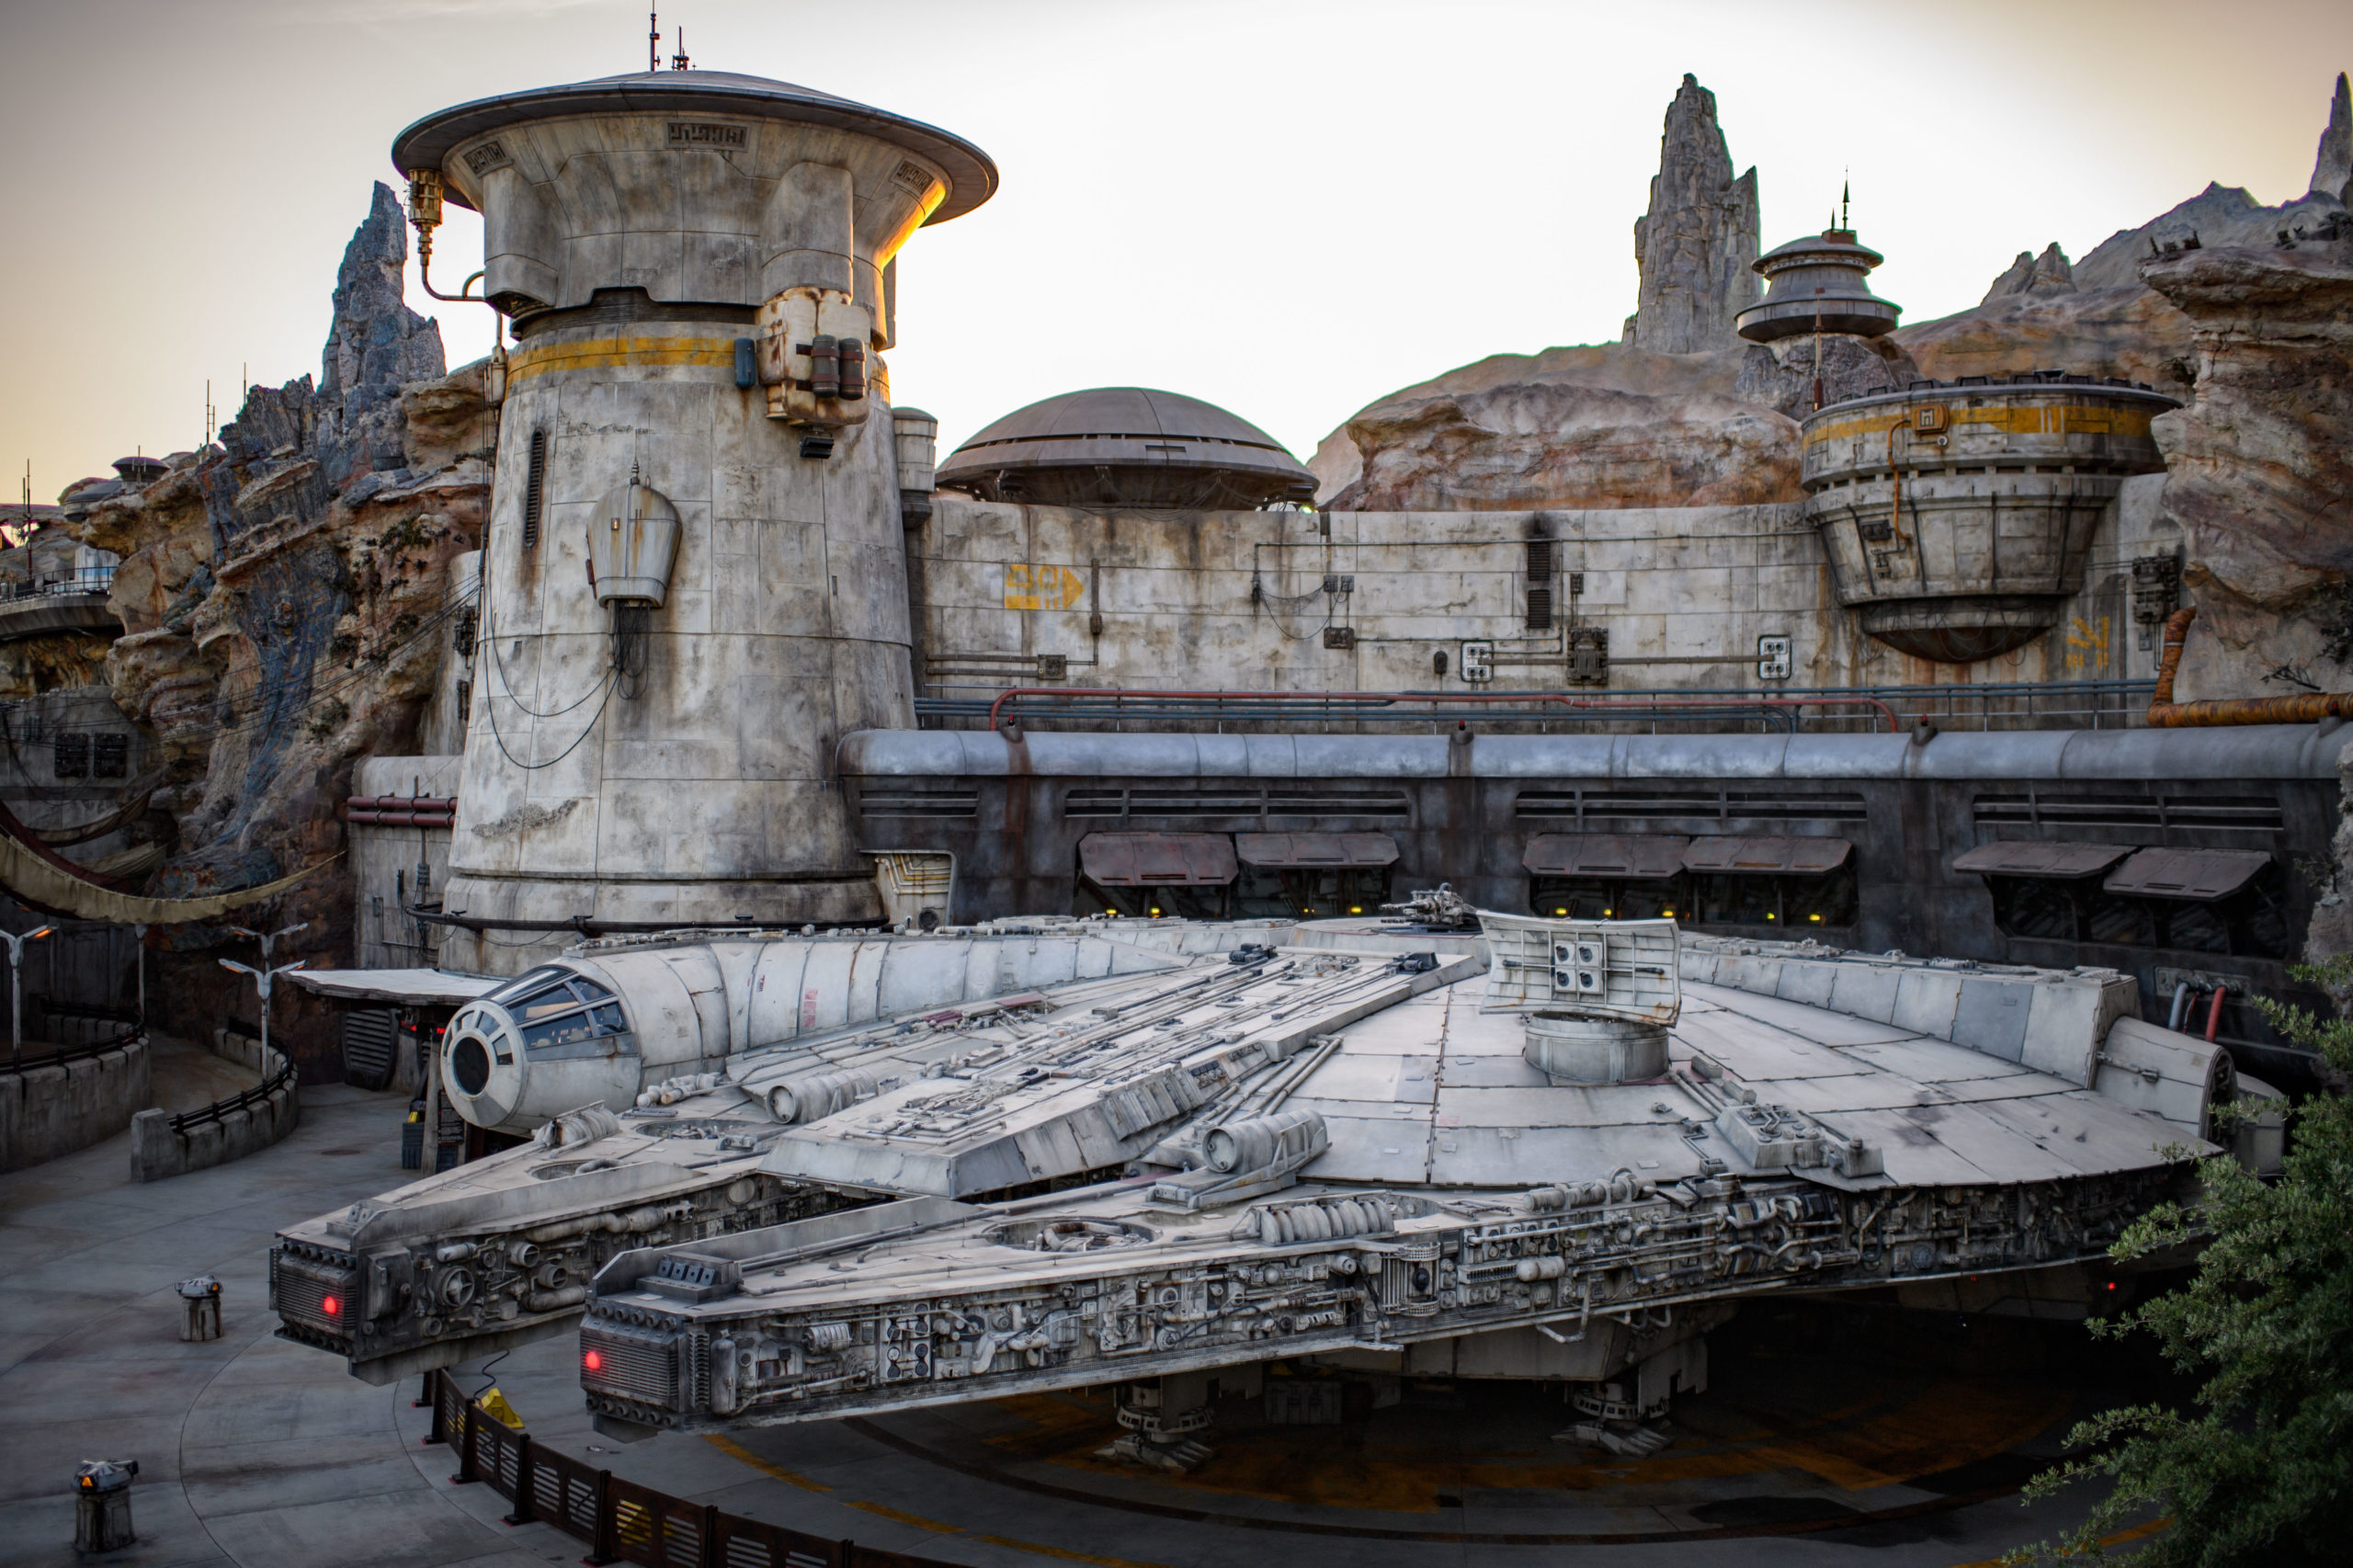
Photo: Richard Harbaugh
You’re standing in line 40 minutes less than those suckers in Orlando! Although, on the downside, you are waiting five minutes more this month than last time.
Average Waits at Disneyland Park
Here are the other average waits at Disneyland Park this month:
- Splash Mountain – 78 minutes, up 22
- Space Mountain – 72 minutes, down 3
- Indiana Jones Adventure – 66 minutes, up 6
- Millennium Falcon: Smugglers Run – 65 minutes, up 11
- Matterhorn Bobsleds – 62 minutes, up 7
- Big Thunder Mountain Railroad – 50 minutes, up 1
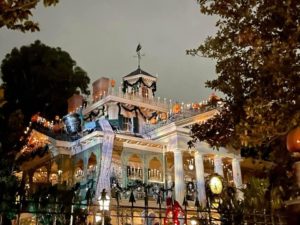
- Haunted Mansion – 46 minutes, up 2
- Star Tours – The Adventures Continue! – 45 minutes, up 12
- Buzz Lightyear Astro Blasters – 43 minutes, up 4
- Peter Pan’s Flight – 42 minutes, up 1
- Jungle Cruise – 40 minutes, up 3
- Alice in Wonderland – 39 minutes, up 1
- Dumbo the Flying Elephant – 38 minutes, up 2
- Astro Orbiter – 36 minutes, up 2
- Autopia – 35 minutes, up 5
- Storybook Land Canal Boats – 32 minutes, up 3
- Snow White’s Enchanted Wish – 28 minutes, no change
- Toad’s Wild Ride – 27 minutes, up 1
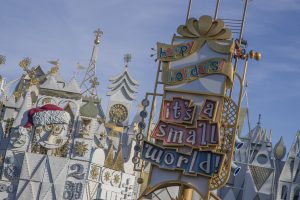
- It’s a Small World – 26 minutes, down 1
- Disneyland Railroad – 25 minutes, up 5
- Casey Junior Circus Train – 24 minutes, down 1
- Pinocchio’s Daring Journey – 23 minutes, up 2
- The Many Adventures of Winnie the Pooh – 20 minutes, down 2
- Mad Tea Party – 19 minutes, up 1
- Little Mermaid ~ Ariel’s Undersea Adventures – 18 minutes, up 2
- King Arthur Carrousel – 16 minutes, no change
- Disneyland Monorail – 8 minutes, down 1
Overall, Disneyland Park attractions averaged a wait of 39 minutes, up three minutes from last time.
You’ll notice that Splash Mountain spiked due to the increasingly hot weather at the park. But, of course, that’s standard behavior during summer vacation.
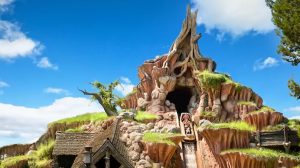
Photo: Disneyland
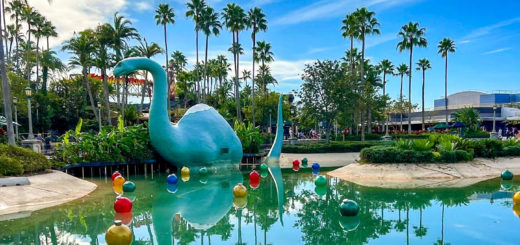
Disney California Adventure
Over the past few months, two attractions have required more line time than all the others at Disney California Adventure.
Radiator Springs Racers has stood as the park alpha for a decade now, and that remains true to this day.
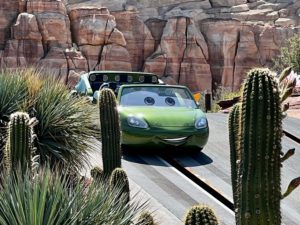
The Cars Land centerpiece struggled through a tough month with downtime at the start and end of June.
For the entire month, guests waited an average of 100 minutes here, an increase of 19 minutes.
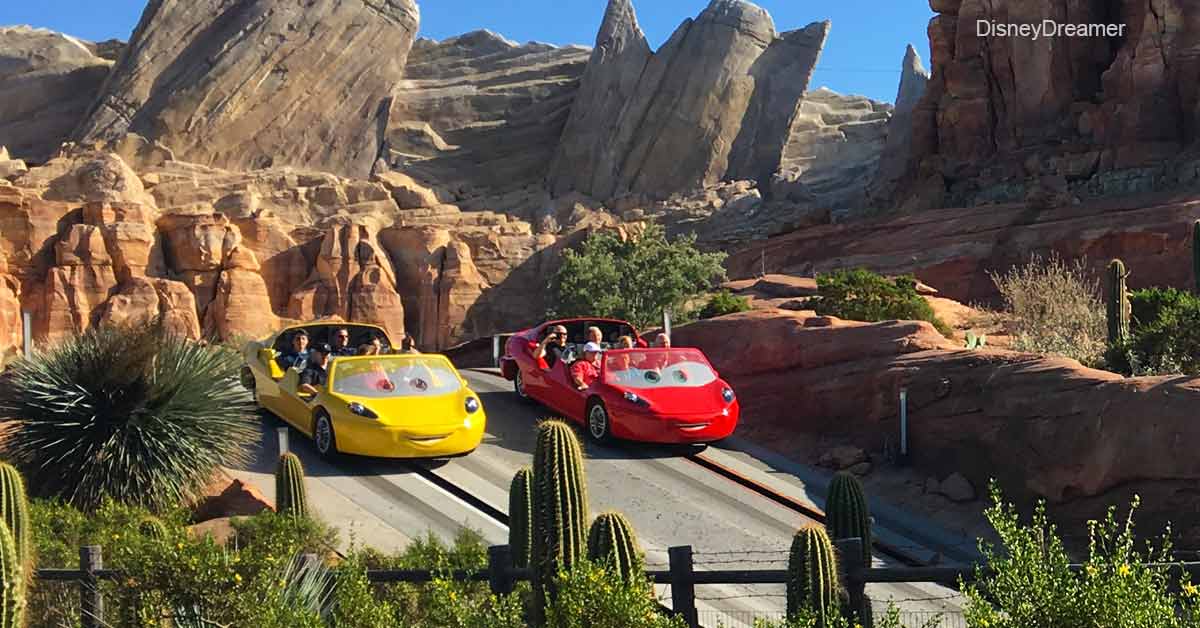
Photo: DisneyDreamer.com
WEB SLINGERS: A Spider-Man Adventure also increased a bit, but the gap has widened between the two attractions.
A few months ago, WEB SLINGERS averaged longer waits. Now, it’s settled at 68 minutes, up nine minutes from last time.
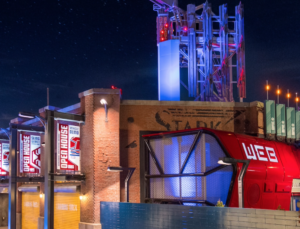
Photo: Disneyland
Still, that’s a far cry from Radiator Springs Racers. I suspect that the mechanical issues on that ride played a significant factor in the difference, though.
Wait Times at Disney California Adventure
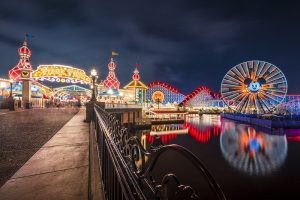
Photo: Disney
Here are the average waits for the other Disney California Adventure attractions:
- Guardians of the Galaxy – Mission: BREAKOUT! – 65 minutes, no change
- Toy Story Mania! – 64 minutes, up 8
- Grizzly River Run – 63 minutes, up 28
- Soarin’ Around the World – 57 minutes, up 6
- Goofy’s Sky School – 45 minutes, up 9
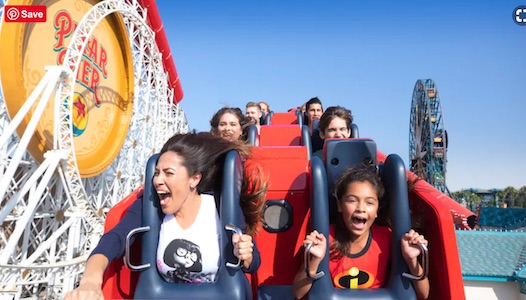
- The Incredicoaster – 44 minutes, up 7
- Monsters, Inc. Mike & Sulley to the Rescue! – 44 minutes, up 2
- Pixar Pal-A-Round – 35 minutes, up 6
- Inside Out Emotional Whirlwind – 23 minutes, no change
- The Little Mermaid ~ Ariel’s Undersea Adventures – 20 minutes, up 4
- Silly Symphony Swings – 19 minutes, up 3
- Mater’s Junkyard Jamboree – 18 minutes, down 1
- Jumpin’ Jellyfish – 16 minutes, up 3
- Golden Zephyr – 12 minutes, up 4
- Jessie’s Critter Carousel – 7 minutes, up 2
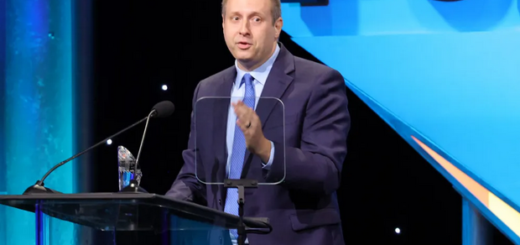
The Grizzly River Run surge reinforces what I said earlier about Splash Mountain. Even Jeff Bezos and his girlfriend were cooling off here the other day.
People need wet rides to survive the summer in Southern California.
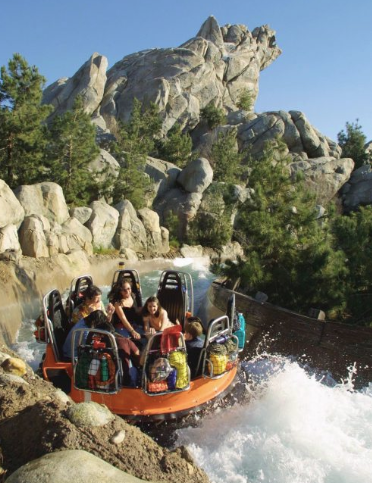
Photo: Disney
Overall, Disney California Adventure attractions averaged a wait of 39 minutes, up six minutes from last time.
So, people waited 39 minutes per attraction at Disneyland Resort this month.
Photo: DIsneyland
Those numbers should increase over the next month before dropping dramatically for the following two months.
Thanks for visiting MickeyBlog.com! Want to go to Disney? For a FREE quote on your next Disney vacation, please fill out the form below and one of the agents from MickeyTravels, a Platinum level Authorized Disney Vacation Planner, will be in touch soon!
Feature Photo: Disney