Walt Disney World Wait Times for Second Week of February 2022
Walt Disney World just claimed some of its best January crowds ever. February started with even more people at the parks.
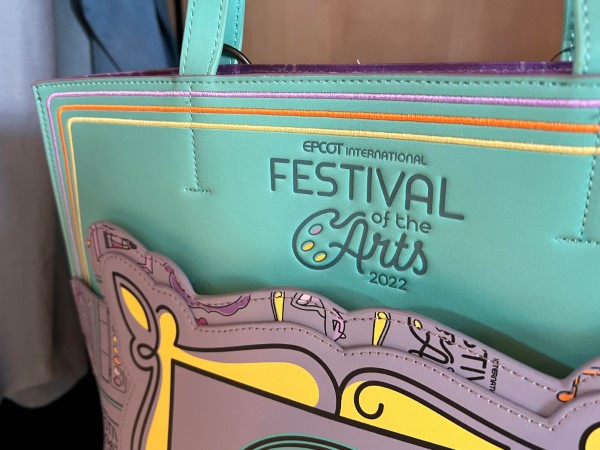
Obviously, this trend won’t continue indefinitely. With the 2022 EPCOT International Festival of the Arts closing soon, crowds should shrink…until Spring Break.
Yeah, it’s gonna be a crazy year at Disney theme parks. But let’s not get ahead of ourselves!
How were Disney’s wait times for the second week of February? Read on to find out!

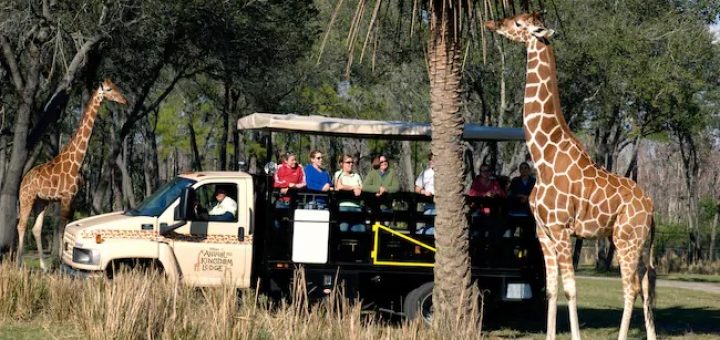
Disney’s Animal Kingdom
I skimmed a bit to glance at one park’s results. Overall, Animal Kingdom appears to hover in the same range as last time.
To wit, Avatar Flight of Passage came with a wait of 101 minutes this past week, down a minute from the last article.
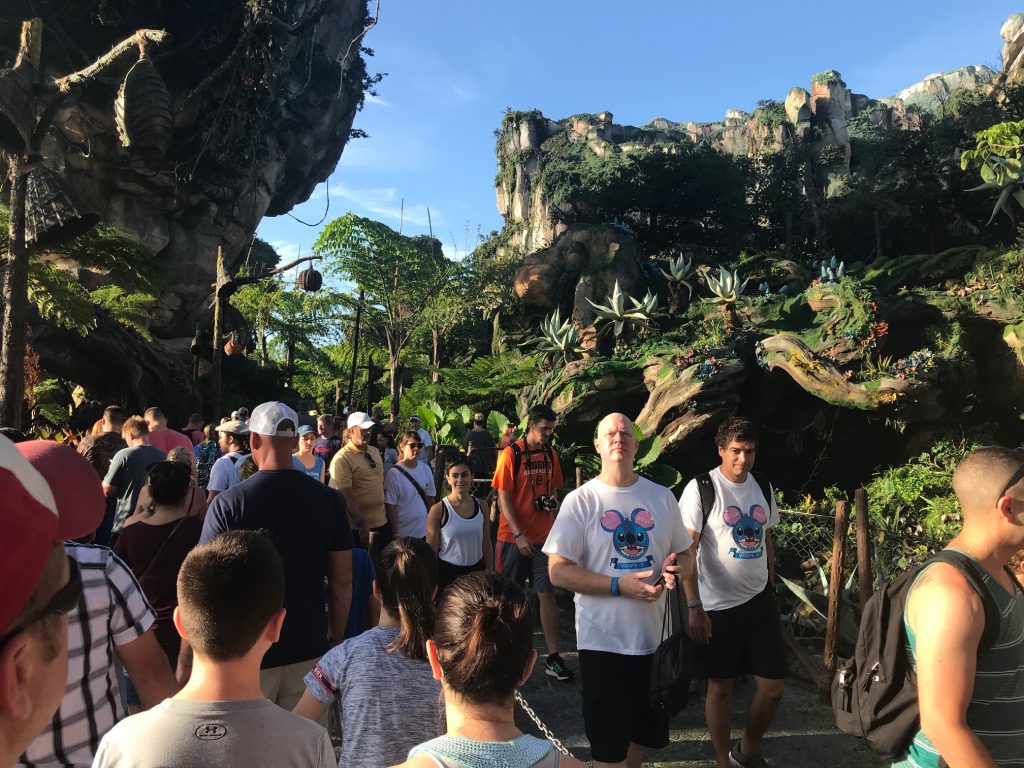
Meanwhile, Na’vi River Journey averaged 60 minutes of line time, down two minutes.
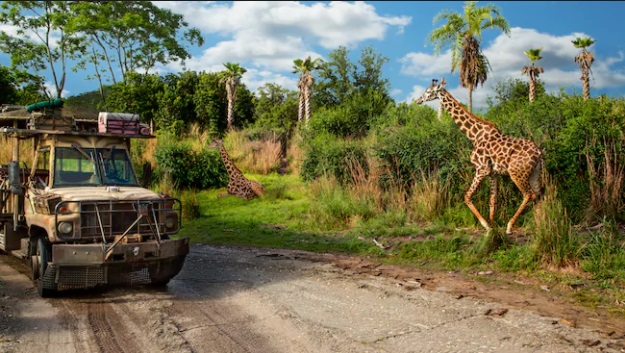
Kilimanjaro Safaris similarly stayed in the same range. It fell from 56 minutes to 55 minutes.
Across three rides, we’re only talking about a four-minute difference from last time. I’d call that status quo.
Here’s everything else at Animal Kingdom:
- DINOSAUR – 28 minutes, no change
- TriceraTop Spin – 20 minutes, up 5
- It’s Tough to Be a Bug! – 10 minutes, down 5
- Kali River Rapids – 5 minutes, no change
With Expedition Everest offline right now, people don’t seem to be overwhelming the lesser rides.
In fact, you’ll notice that those four attractions came with an overall change in wait times of…zero.
Overall, the average Animal Kingdom attraction required a wait of 40 minutes, down one minute from last time. That’s about as status quo as we can get.
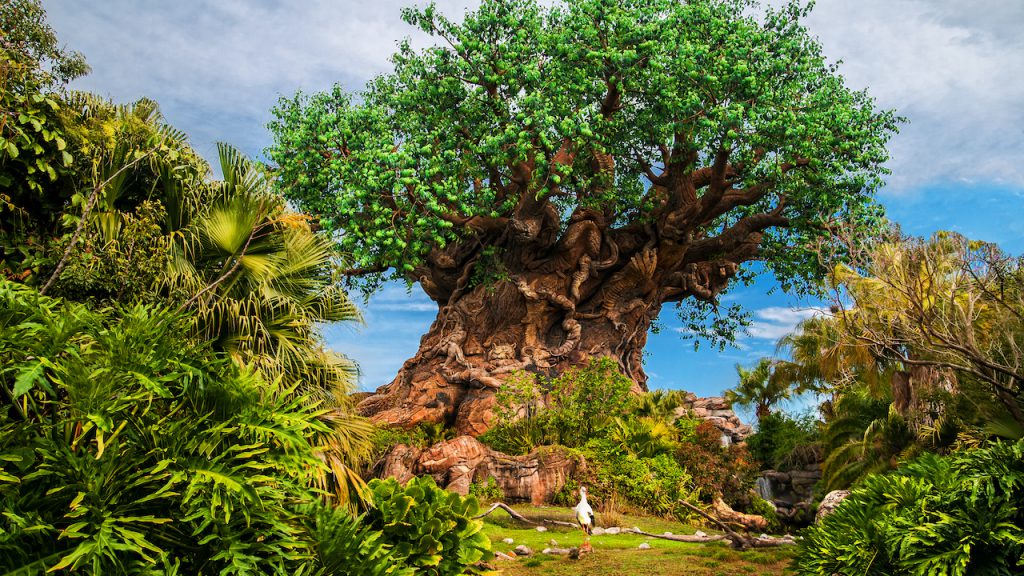
Photo: Disney
Disney’s Hollywood Studios
Naturally, you’re wondering about the other parks, and I’m here to tell you that the next one won’t be pretty.
Star Wars: Rise of the Resistance spiked to a three-hour wait, up 54 minutes or nearly an hour from last time.
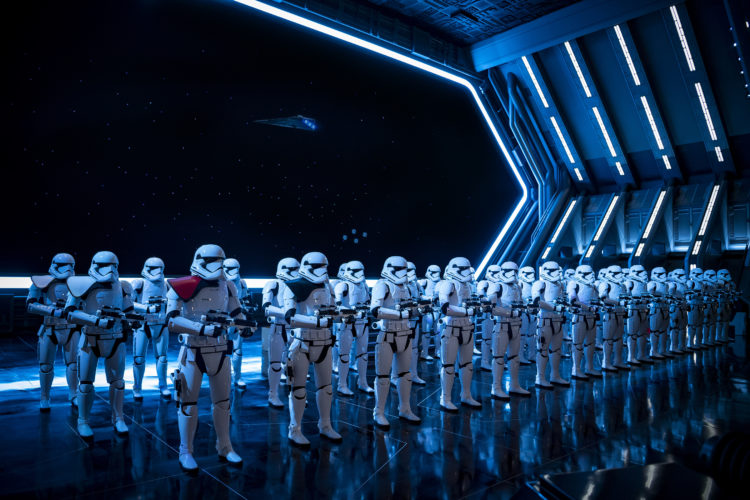
Photo: Matt Stroshane
You may have heard that Rise of the Resistance experienced some downtime last week and also struggled to open on time.
Those issues definitely impacted the bottom line here. Three hours would be a lot during Christmas week.
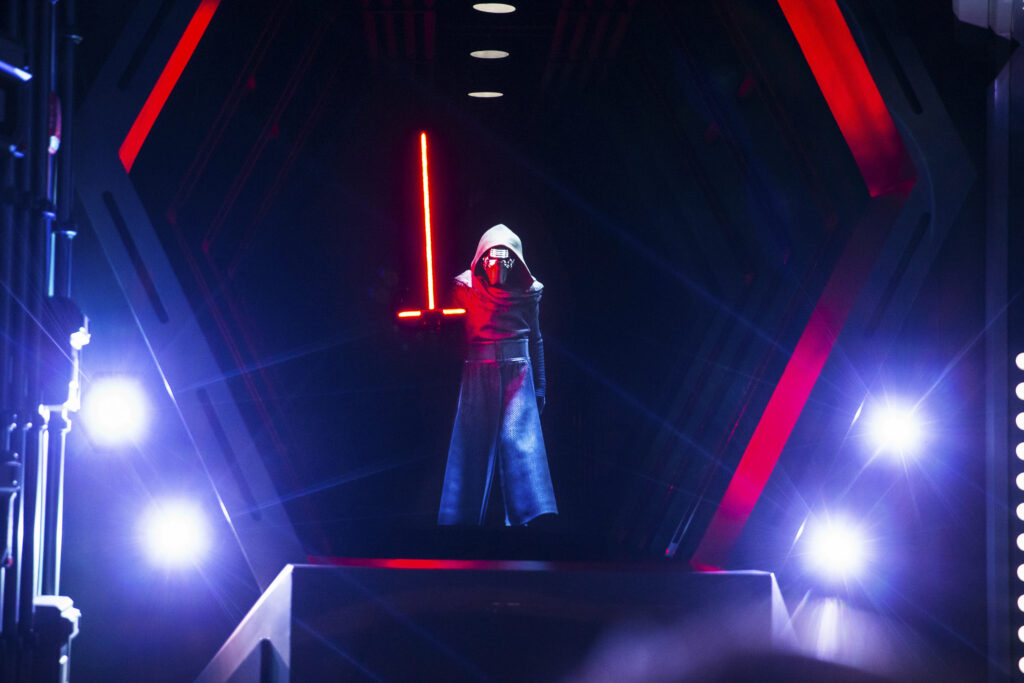
Photo: Steven Diaz
In fact, that’s 25 minutes longer than the wait during the 12 Days of Christmas!
Were the only Hollywood Studios rides similarly ridiculous? Decide for yourself:
- Twilight Zone Tower of Terror – 125 minutes, up 14
- Slinky Dog Dash – 115 minutes, up 22
- Rock ‘n’ Roller Coaster Starring Aerosmith – 85 minutes, up 16
- Mickey & Minnie’s Runaway Railway – 75 minutes, up 4
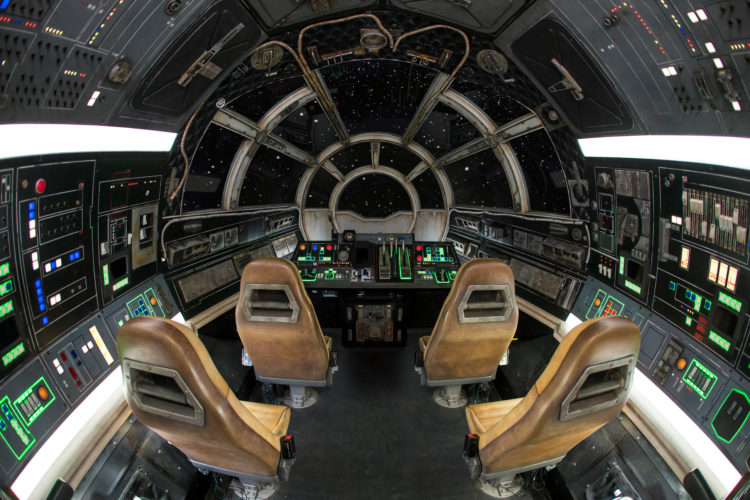
- Millennium Falcon: Smugglers Run – 74 minutes, up 7
- Toy Story Mania! – 65 minutes, up 3
- Alien Swirling Saucers – 44 minutes, up 6
- Star Tours – The Adventures Continue! – 34 minutes, down 1
- Minnie & Mickey at Red Carpet Dreams – 26 minutes, up 4
- Olaf at Celebrity Spotlight – 26 minutes, up 1
- Lightning McQueen’s Racing Academy – 18 minutes, no change
- Muppet*Vision 3D – 14 minutes, up 3
Obviously, the overall wait times at this park increased. Last week, Hollywood Studios rides averaged 59 updates, up six minutes from the previous week.
When the average wait at a park is an hour, the place is crowded. I suspect this trend will only worsen in two weeks when Star Wars: Galactic Starcruiser opens.
Credit: Disney
EPCOT
Okay, I finally have some good news for you. EPCOT’s top two attractions improved significantly from last week.
After a one-week break, Remy’s Ratatouille Adventure has reclaimed the dubious distinction of having the longest wait.
Guests stood in line for an average of 74 minutes, down 15 minutes week over week.
Similarly, last week’s number one, Frozen Ever After, improved from 82 minutes of line time to a more tolerable 66 minutes.
Image Credit: Disney
That’s still on the high end for Frozen Ever After, but it’s not insane like the previous week.
Here’s everything else at EPCOT:
- Test Track – 60 minutes, down 2
- Soarin’ Around the World – 35 minutes, down 4
- Spaceship Earth – 19 minutes, up 1
- Living with the Land – 15 minutes, down 7
- The Seas with Nemo & Friends – 14 minutes, down 5
- Mission: SPACE – 13 minutes, down 4
- Journey into Imagination with Figment – 12 minutes, down 3
- Turtle Talk with Crush – 11 minutes, no change
- Gran Fiesta Tour Starring the Three Caballeros – 10 minutes, no change
Photo: Disney
Overall, guests waited 30 minutes on average for EPCOT attractions. That’s down three minutes from last time…and far better than Hollywood Studios.
Magic Kingdom
So, two parks have improved while the other has grown comically crowded. Where does the most popular park fall on this scale?
At Magic Kingdom, guests waited 110 minutes for Seven Dwarfs Mine Train, a 20-minute increase from last time.
Similarly, Jungle Cruise line time went up from 82 minutes to 89 minutes. You get the gist. So, here’s the rest of Magic Kingdom:
- Peter Pan’s Flight – 82 minutes, up 2
- Space Mountain – 75 minutes, up 25 (!)
- Haunted Mansion – 58 minutes, up 3
- Astro Orbiter – 55 minutes, up 17
- Buzz Lightyear’s Space Ranger Spin – 51 minutes, up 10
- Pirates of the Caribbean – 51 minutes, up 13
- The Many Adventures of Winnie the Pooh – 47 minutes, up 2
- Splash Mountain – 46 minutes, n/a
- Dumbo the Flying Elephant – 44 minutes, up 16
- The Barnstormer – 42 minutes, up 10
- Under the Sea ~ Journey of the Little Mermaid – 42 minutes, up 12
- It’s a Small World – 41 minutes, up 5
- The Magic Carpets of Aladdin – 39 minutes, up 14
- Tomorrowland Speedway – 35 minutes, up 11
- Princess Fairytale Hall – 33 minutes, up 7
- Mad Tea Party – 28 minutes, up 10
- Tomorrowland Transit Authority PeopleMover – 26 minutes, up 6
- Prince Charming Regal Carrousel – 24 minutes, up 5
- Monsters, Inc. Laugh Floor – 20 minutes, no change
- Mickey’s PhilharMagic – 20 minutes, down 2
- Town Square Theater – 19 minutes, up 9
- Country Bear Jamboree – 14 minutes, up 4
- Walt Disney’s Carousel of Progress – 6 minutes, up 1
The average Magic Kingdom attraction required a wait of 42 minutes, up eight minutes from last time.