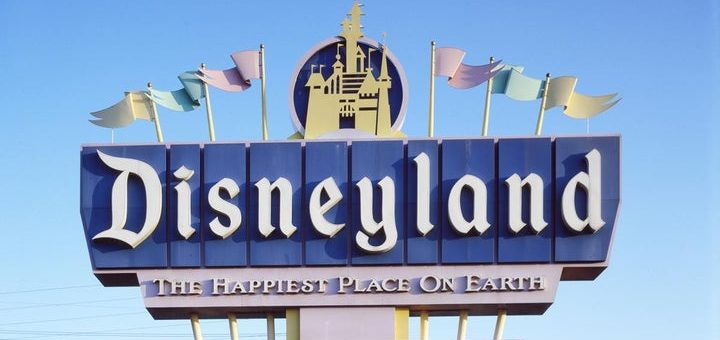
Disneyland Wait Times for January 2022
The Happiest Place on Earth doesn’t work quite the same as Walt Disney World.
Disneyland Resort operates “only” two theme parks, which is both A LOT and just half of what Walt Disney World offers.
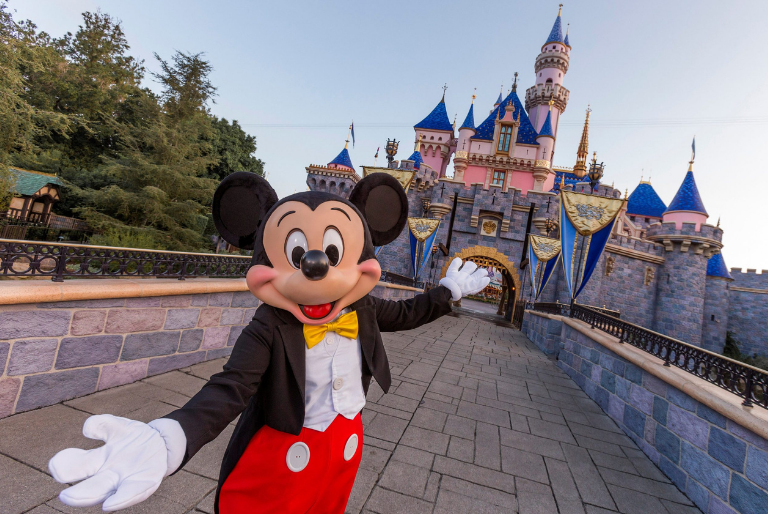
Image: Disney
As such, this park’s most popular rides exhibit different behaviors from their East Coast counterparts.
We tracked this last month before the holiday period started. Now that the holidays have ended, this is an excellent time to compare.
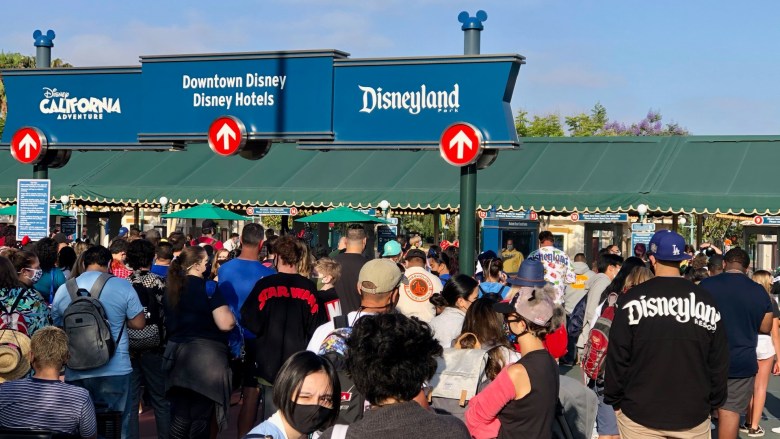
Photo by Brady MacDonald / Orange County Register
Here are the Disneyland wait times for January 2022, which will include the last two weeks of 2021.
Disneyland Park
As the world’s first theme park, Disneyland offers more attractions than virtually any other place on the planet, save for Magic Kingdom.
Source: PopSugar
The benefit of this depth of ride options is that it keeps wait times under control.
An average of 55,000 people visit Disneyland each day. However, they have so many rides to choose from that only a few require prolonged line time.
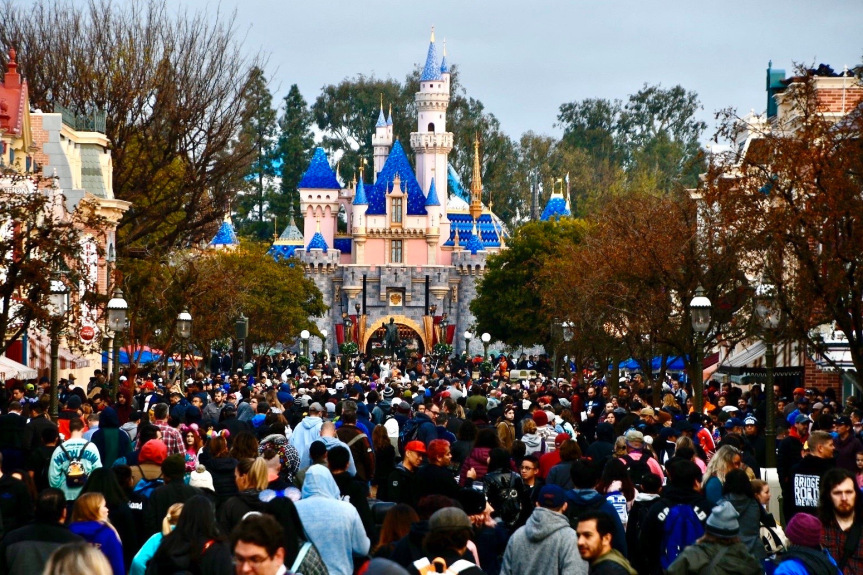
Image Credit: Jeff Gritchen, Orange County Register
However, the past month has skewed the data some. To wit, the last time we had this conversation, 15 attractions came with a wait of 17 minutes or less.
This time, that number has dropped to eight. So, the middle tier of attractions grew more popular over the past month.
Credit: Disney
Let’s examine some of the most popular attractions first. As usual, Star Wars: Rise of the Resistance claimed the most extensive lines.
Guests waited an average of 92 minutes to experience Disney’s finest. While that’s a lot, it’s nearly half an hour less than last time.
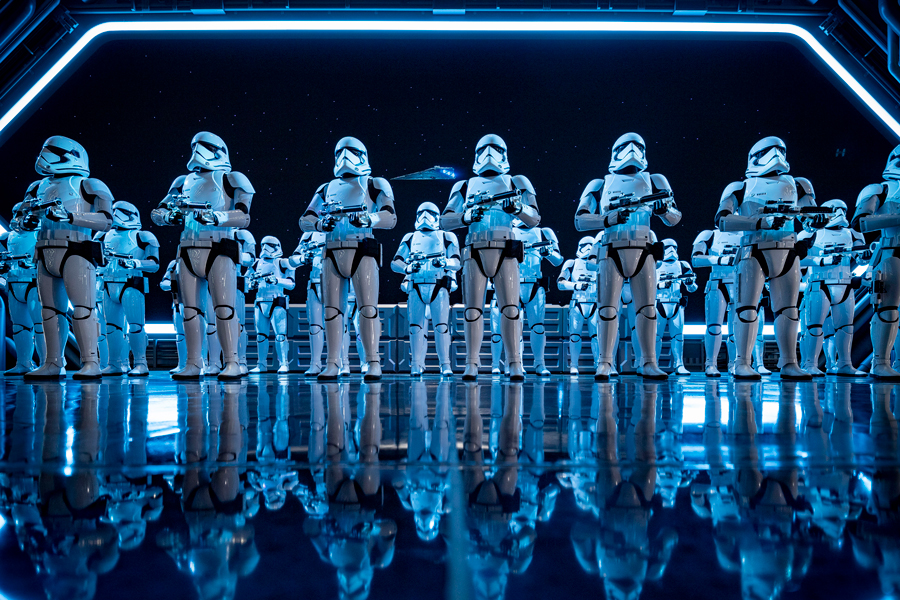
Image Credit: Disney
During the first two weeks of December, Rise of the Resistance hovered at 120 minutes of line time.
After all this time, Space Mountain remains consistently popular at Disneyland, and that’s with better throughput than at Magic Kingdom.
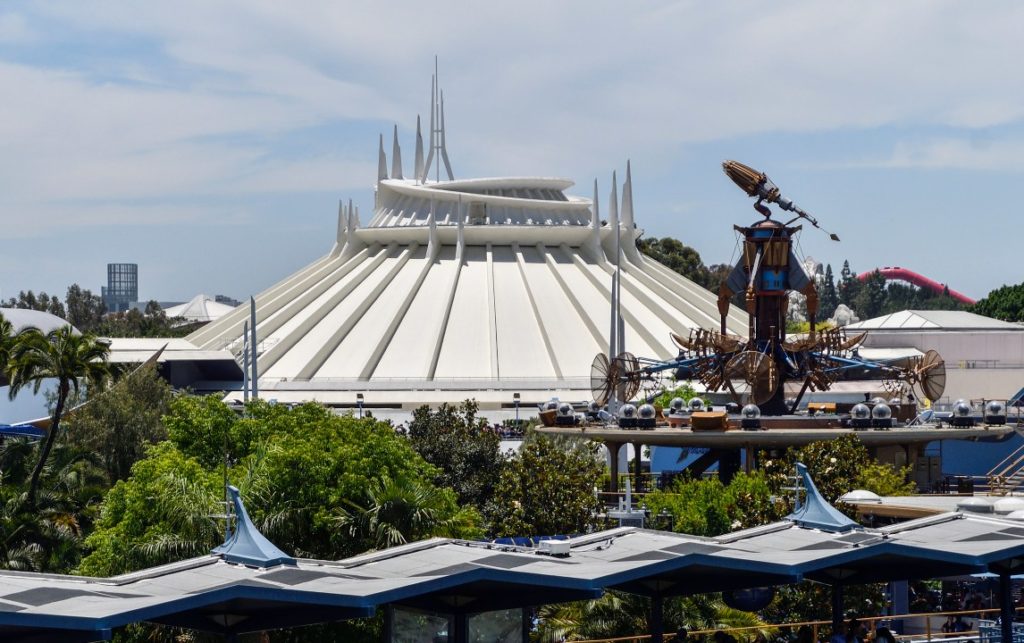
Photo by Jeff Gritchen, Orange County Register/SCNG)
The outer space roller coaster averaged a wait of 66 minutes, an increase of 24 minutes from last time.
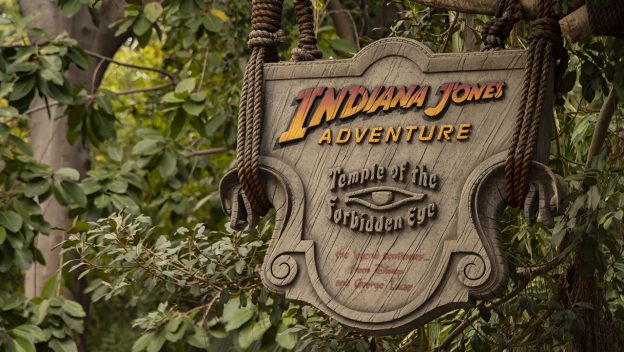
Indiana Jones Adventure is third in line time so far this month. Its 60-minute wait is nearly double the 31-minute average in early December.
Rounding out the top five are Millennium Falcon: Smugglers Run and Matterhorn Bobsleds.
The other Star Wars ride averaged a wait of 55 minutes, up 26 minutes from last time.
Meanwhile, the roller coaster that triggered the Great Coaster Wars still possesses an average wait of 45 minutes more than 60 years after its creation.
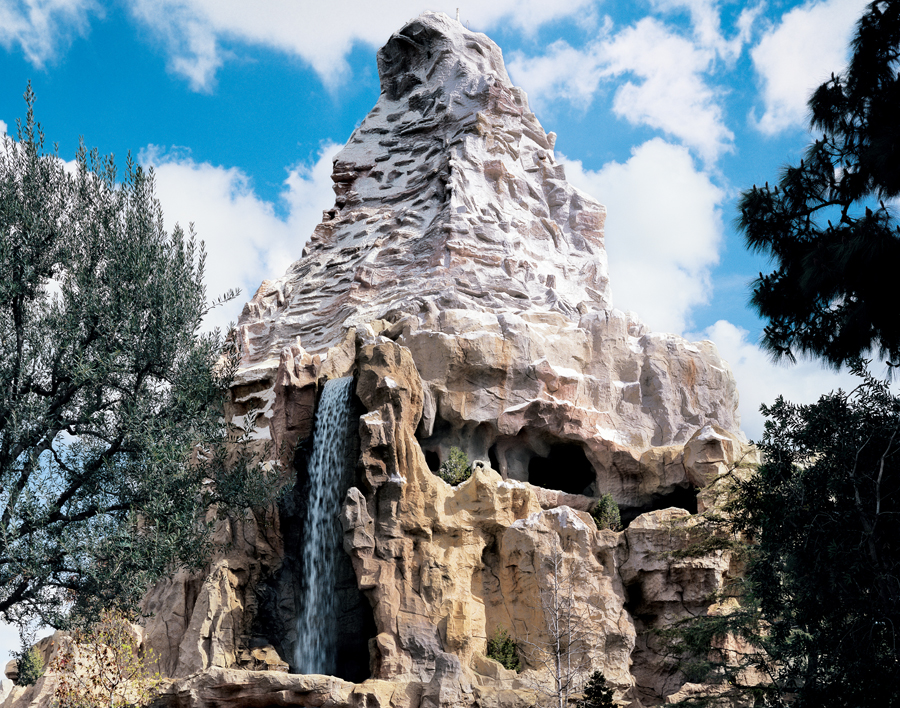
Image: Disneyland
Everything Else at Disneyland
Here are the other Disneyland Park wait times:
- Haunted Mansion – 44 minutes, down 3
- Big Thunder Mountain Railroad – 43 minutes, up 20
- Roger Rabbit’s Car Toon Spin – 42 minutes, up 18
- Peter Pan’s Fight – 35 minutes, no change
- Jungle Cruise – 34 minutes, up 1
- Buzz Lightyear Astro Blasters – 32 minutes, up 16
- Star Tours – The Adventures Continue! – 31 minutes, up 17
- Pirates of the Caribbean – 30 minutes, up 2
- Astro Orbiter – 29 minutes, up 6
- Dumbo the Flying Elephant – 29 minutes, down 1
- Alice in Wonderland – 28 minutes, up 1
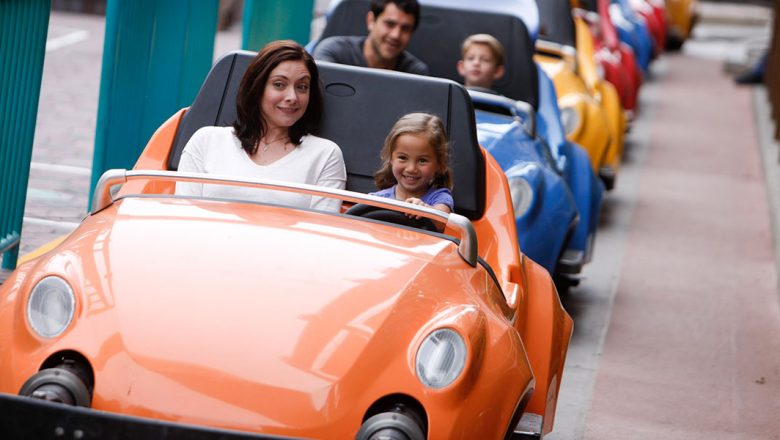
- Autopia – 28 minutes, up 12
- Storybook Land Canal Boats – 26 minutes, up 11
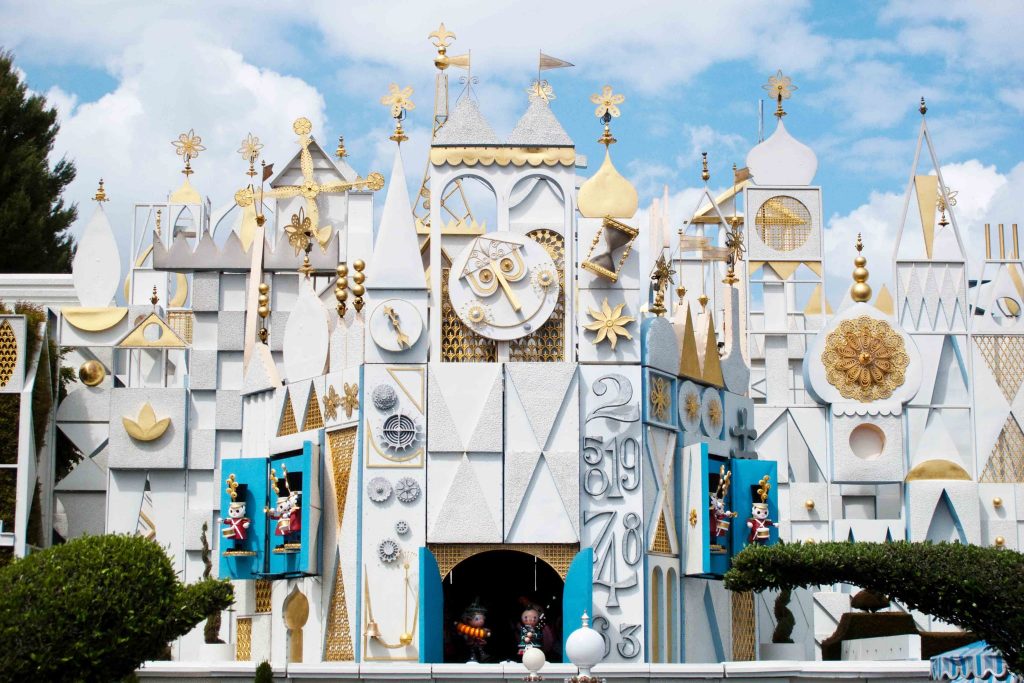
- It’s a Small World – 25 minutes, up 9
- Splash Mountain – 25 minutes, n/a
- Gadget’s Go Coaster – 24 minutes, up 8
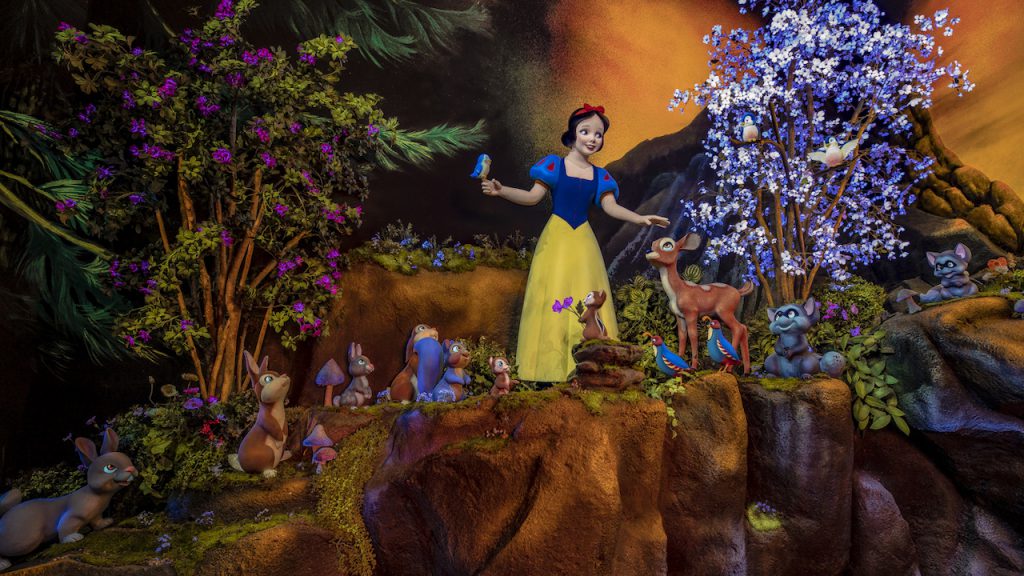
- Snow White’s Enchanted Wish – 22 minutes, up 2
- Disneyland Railroad – 21 minutes, up 6
- Toad’s Wild Ride – 20 minutes, up 5
- Pinocchio’s Daring Journey – 15 minutes, no change
- Casey Jr. Circus Train – 12 minutes, up 2
- The Many Adventures of Winnie the Pooh – 11 minutes, no change
- Mad Tea Party – 10 minutes, up 2
- Davy Crockett’s Explorer Canoes – 9 minutes, up 2
- King Arthur Carrousel – 9 minutes, no change
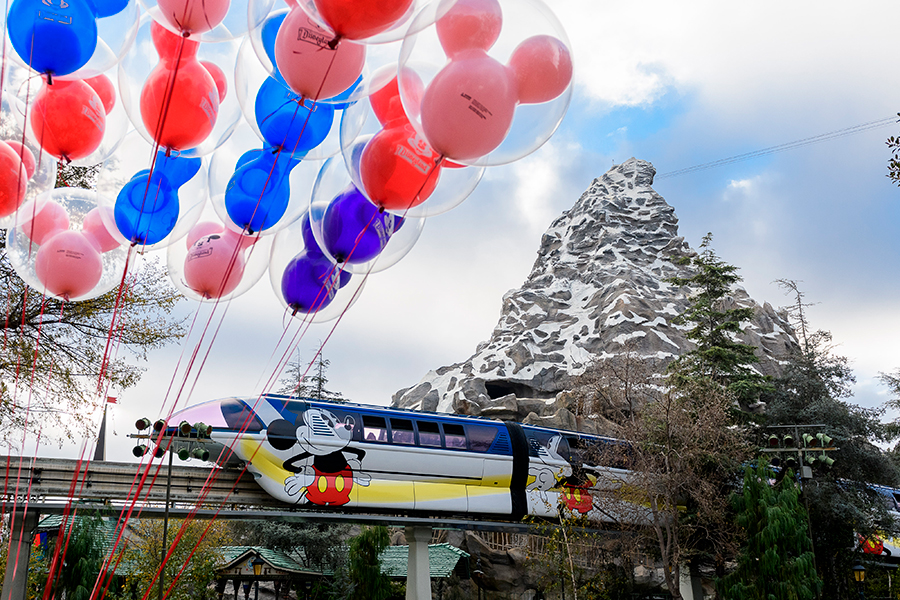
- Disneyland Monorail – 8 minutes, no change
The average Disneyland attraction required a wait of 29 minutes, up 9 minutes from last time.
So, as you can see, even when park wait times increase across the board, Disneyland remains relatively stable overall.
For perspective, at 30 minutes per attraction, you should experience at least 15 rides during a full park day. That’s phenomenal!
Disney California Adventure
Okay, the other park at Disneyland lived in its older sibling’s shadow for most of its existence.
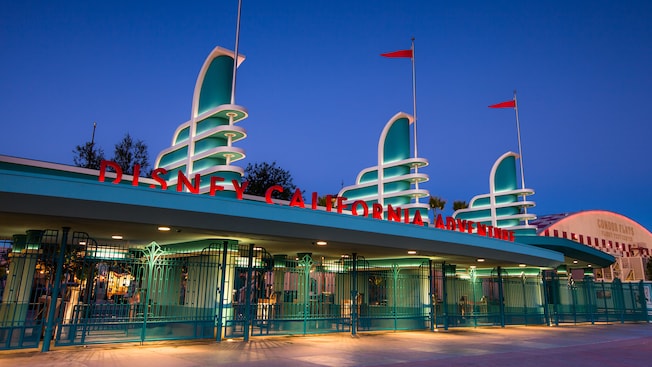
Photo: Disney
The tide has turned over the past few years, though. Disney California Adventure’s additions of Pixar and Marvel rides added to its overall appeal.
Now, some of the most popular attractions at Disneyland Resort reside at DCA.
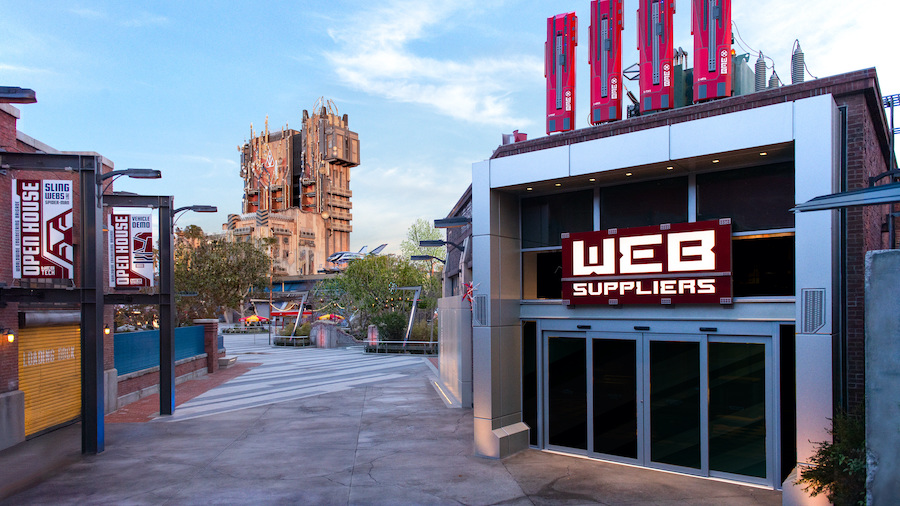
Photo: Christian Thompson/Disneyland Resort
For instance, WEB SLINGERS – A Spider-Man Adventure averaged a wait of 86 minutes, up 14 minutes from last time.
On the plus side, it has stabilized from the wild swings the ride maintained during its earliest days as a standby queue attraction.
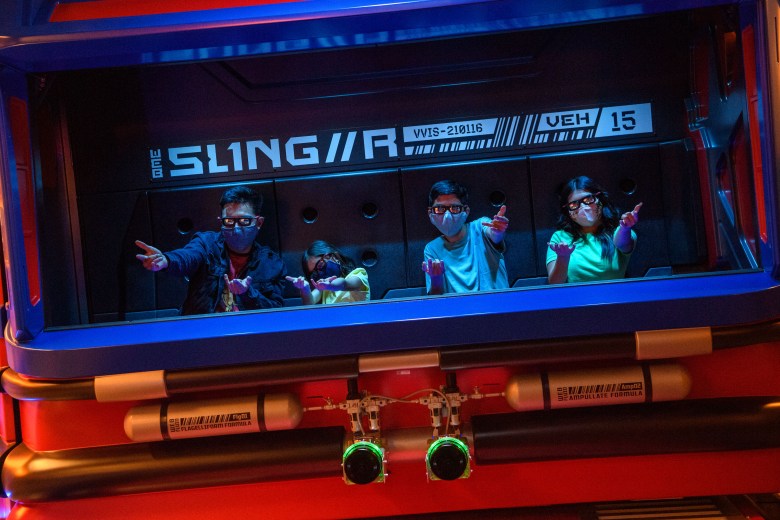
Photo: Disney
The second-longest wait remains Radiator Springs Racers, with an 83-minute wait. That’s a 16-minute increase.
Soarin’ Around the World averages 77 minutes, waaaaay up from last time, when it was just 42 minutes.
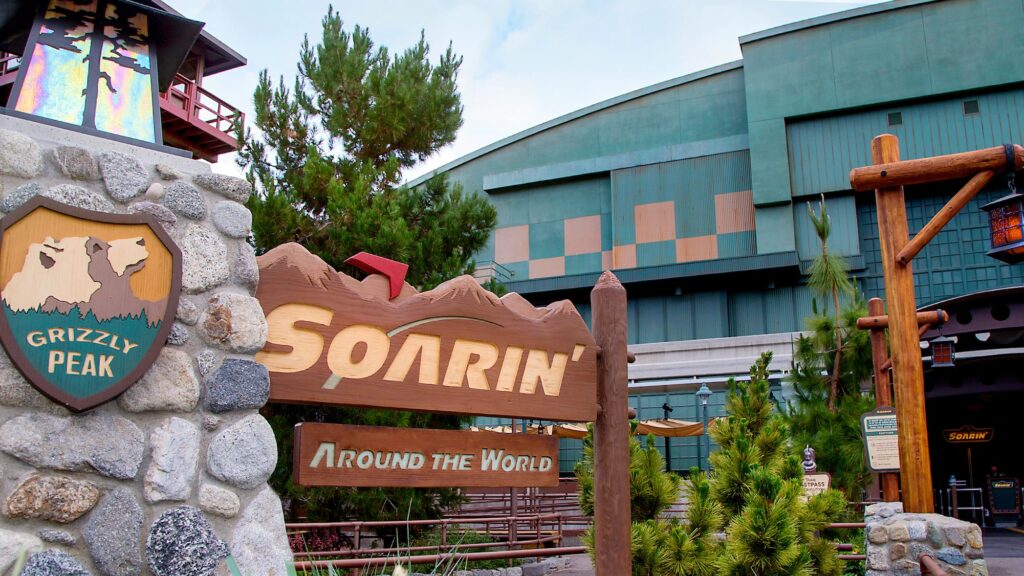
This seems like a good time to mention that these wait times include the holiday season. So, they’re substantially higher than usual.
Here’s the rest of DCA:
- Guardians of the Galaxy – Mission: BREAKOUT! – 68 minutes, up 26
- Toy Story Midway Mania – 58 minutes, up 13
- Monsters, Inc. Mike & Sully to the Rescue! – 42 minutes, up 20
- Goofy Ski School – 38 minutes, up 13
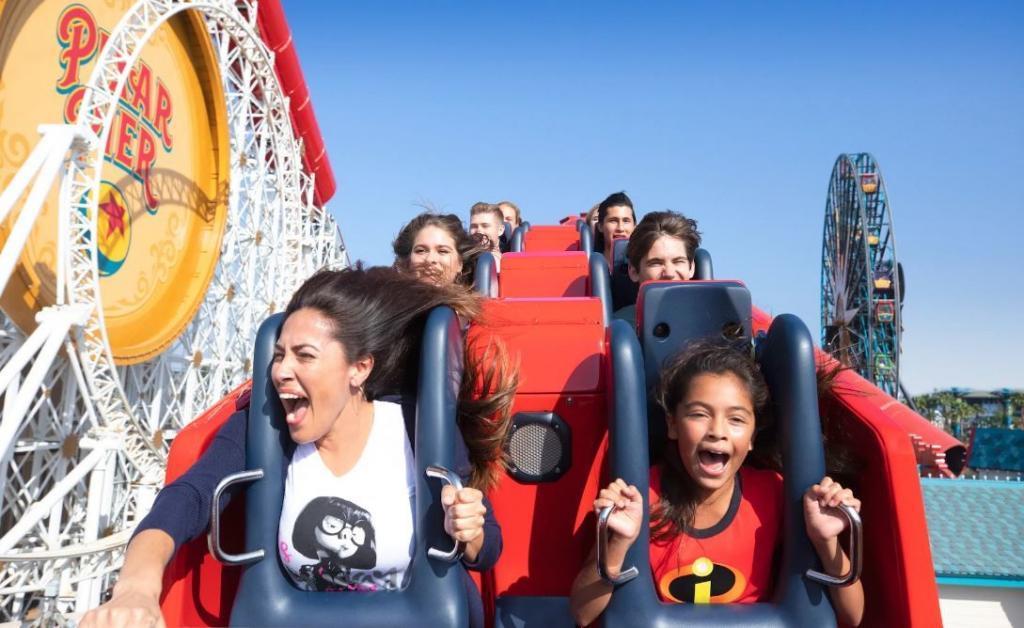
- The Incredicoaster – 33 minutes, up 16
- Luigi’s Rollickin’ Roadsters – 24 minutes, down 4
- Pixar Pal-A-Round – 22 minutes, up 4
- Mater’s Junkyard Jamboree – 21 minutes, up 1
- Grizzly River Run – 15 minutes, up 4
- Silly Symphony Swings – 12 minutes, up 4
- The Little Mermaid ~ Ariel’s Undersea Adventure – 11 minutes, up 2
- Jumpin’ Jellyfish – 10 minutes, down 1
- The Golden Zephyr – 8 minutes, no change
- Jessie’s Critter Carousel – 5 minutes, down 1
Overall, DCA attractions came with an average wait of 31 minutes, up 11 from last time.
Remember that there’s holiday inflation here, though.