Walt Disney World Wait Times for New Year’s Week
Christmas Eve and New Year’s Eve fell on Fridays in 2021. That’s unquestionably the weirdest calendar configuration.
When that happens, guests must choose whether to vacation the week before Christmas Day or the week after.
In last week’s article, we tracked wait times that were only modestly worse than the previous week.
However, the possibility remains that the last week of 2021 proved the worst for park crowds.
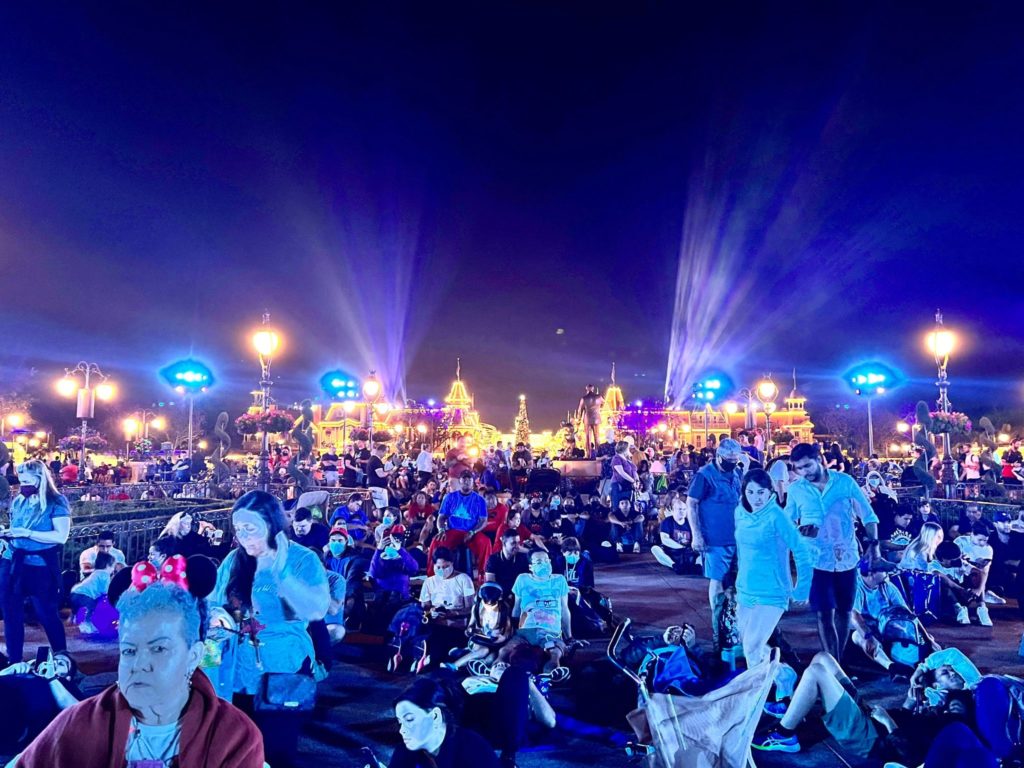
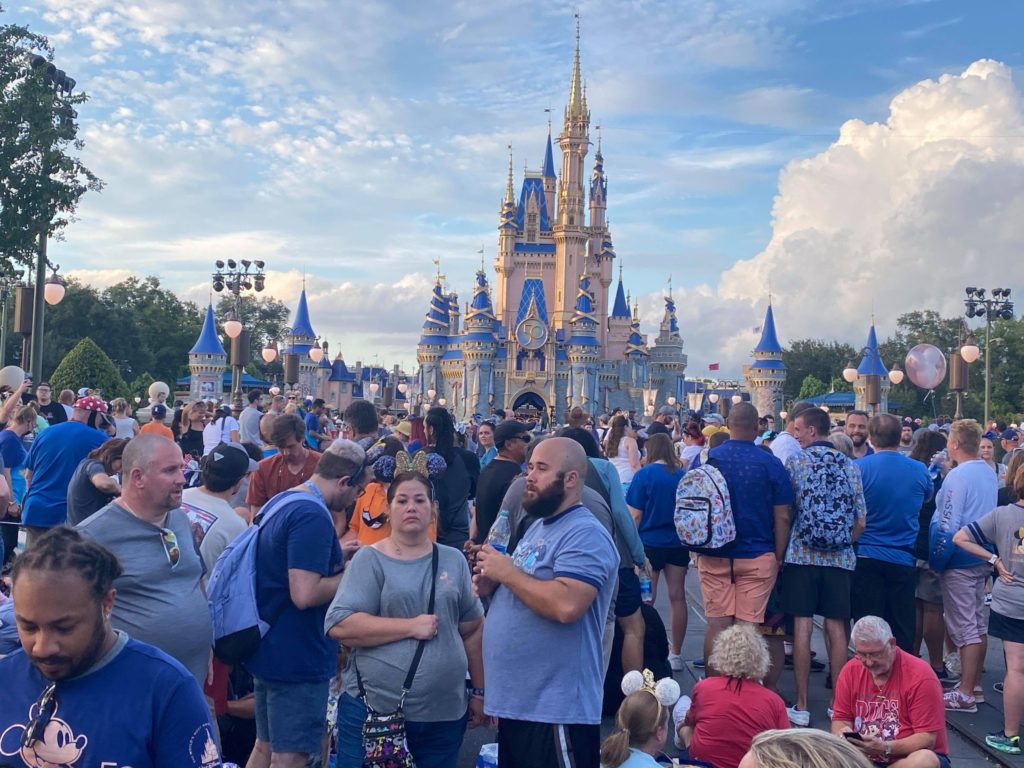
Happy New Years Eve from the Magic Kingdom! Here’s a look at the crowds for the 6:30 showing of enchantment. #DisneyNYEMK pic.twitter.com/x01YNqmuqY
— MickeyBlog.com (@MickeyBlog_) December 31, 2021
Let’s discuss Walt Disney World’s wait times for the week of New Year’s Eve.
Disney’s Animal Kingdom
The lines for Avatar Flight of Passage are rarely short. But, at the end of the year, they’re longer than Dikembe Mutumbo’s wingspan. Or possibly the Nile River.

Photo: ESPN/Twitter
Anyway, during Christmas Week, guests spent 141 minutes waiting for the year. Last week, that number increased minimally to 143 minutes. So, that’s a draw.
How did the second-most popular ride do? Kilimanjaro Safaris increased from 71 to 84 minutes. So, we’re trending toward longer lines after Christmas.
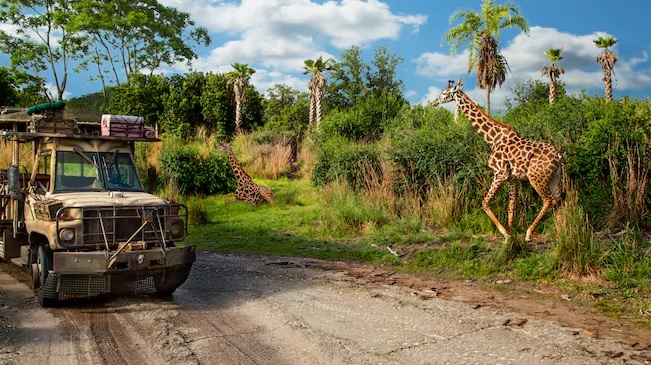
Photo: Disney
Did this trend hold for everything else at the park? Let’s take a look:
- Na’vi River Journey – 78 minutes, no change
- Expedition Everest – 70 minutes, up 30
- DINOSAUR – 60 minutes, up 12
- TriceraTop Spin – 23 minutes, up 3
- It’s Tough to Be a Bug! – 18 minutes, no change
- Kali River Rapids – 15 minutes, down 25
The average Animal Kingdom attraction required a wait of 61 minutes, up five minutes from last time.
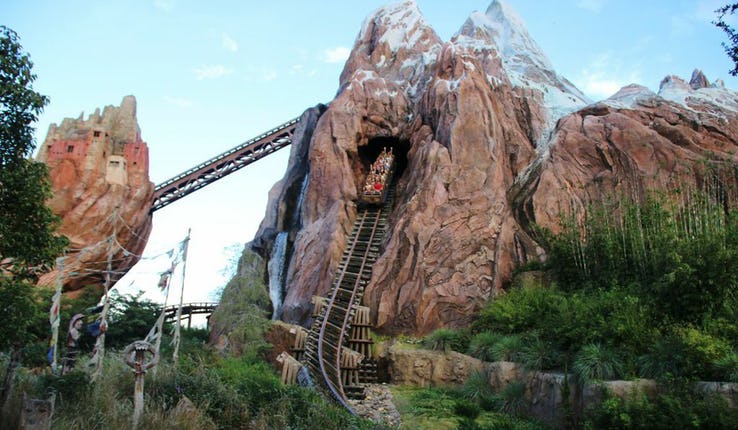
Image Credit: Disney
Also, I should stress that the number would have been larger if not for cold weather in Orlando.
Most guests passed on Kali River Rapids due to, you know, pneumonia concerns.

The other thing that’s undisputed is that people didn’t let the COVID-19 outbreak deter them from visiting the parks.
Disney’s Hollywood Studios
I don’t say this often, but I’m almost afraid to look. It’s like I just stared at the mirror and said Bloody Mary three times. I can feel the chill.
Sure enough, Star Wars: Rise of the Resistance averaged a 162-minute wait, up eight minutes from last time.
Similarly, Slinky Dog Dash’s wait increased seven minutes to 107 minutes on average.
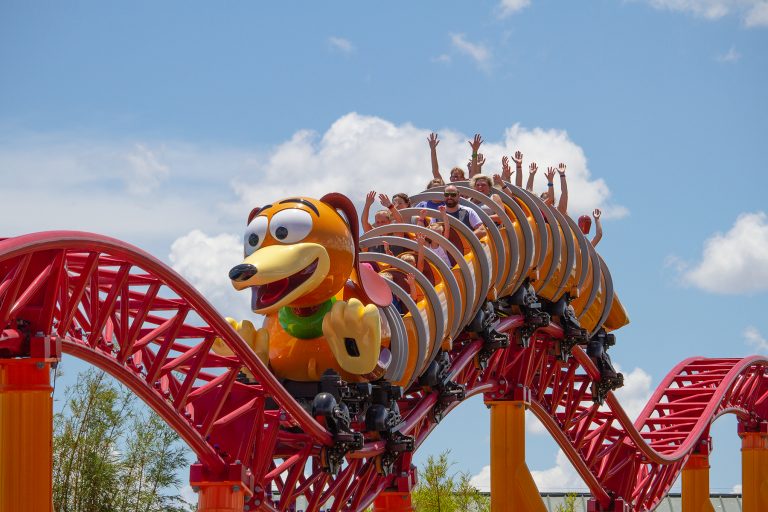
Photo: TheCoasterKings.com
A couple of weeks ago, I theorized that we’re close to the realistic ceiling for wait times on some of these attractions. The stats seem to bear that out.
Here’s everything else at Hollywood Studios:
- Millennium Falcon: Smugglers Run – 91 minutes, up 16
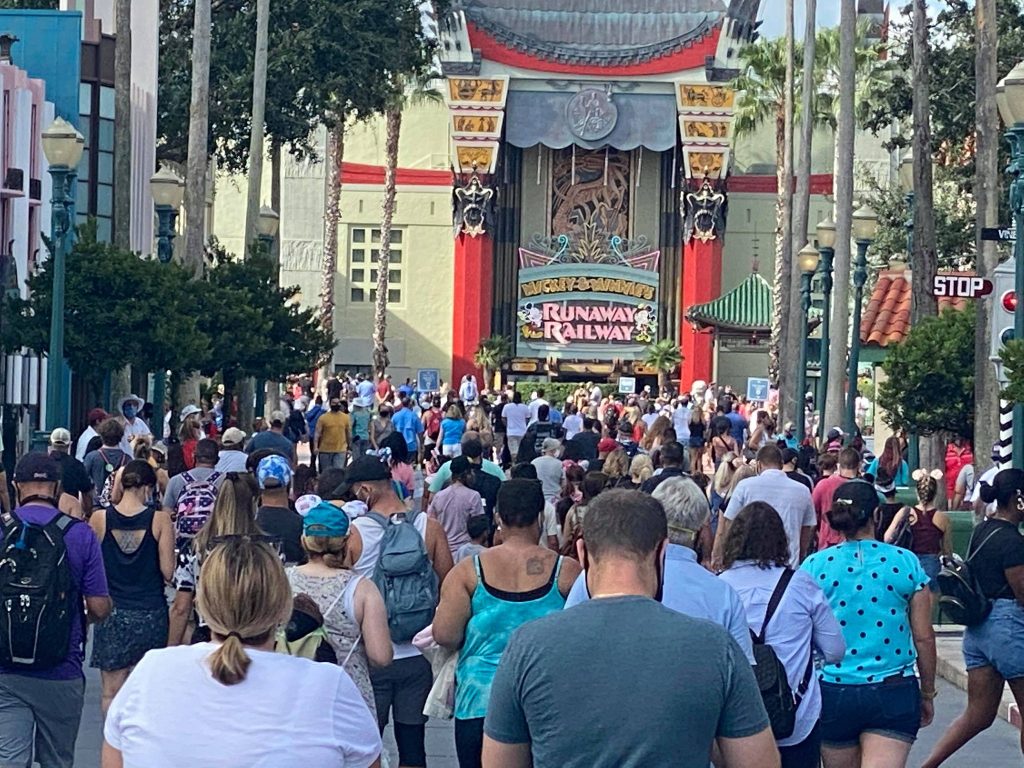
- Mickey & Minnie’s Runaway Railway – 79 minutes, up 12
- Twilight Zone Tower of Terror – 76 minutes, up 21
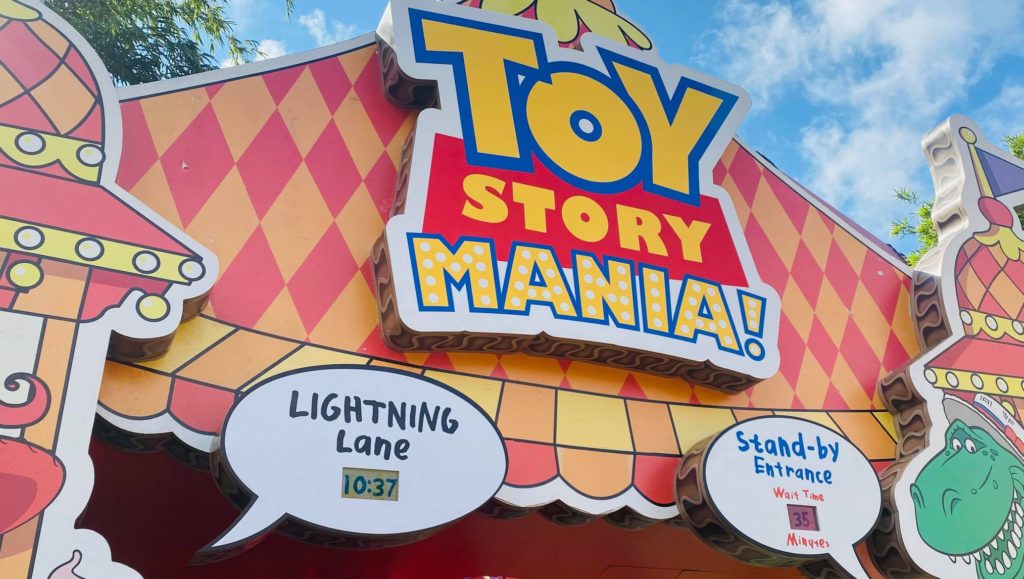
- Toy Story Mania! – 73 minutes, up 7
- Alien Swirling Saucers – 44 minutes, up 4
- Star Tours – The Adventures Continue – 37 minutes, up 6
- Lightning McQueen’s Racing Academy – 15 minutes, no change
- Muppet*Vision 3D – 12 minutes, up 2
So, across two parks, we’ve only had one attraction go down in wait time…and that was weather-related.
The average Hollywood Studios attraction came with a wait of 59 minutes, up eight minutes from Christmas Week.
We’ve got two parks left, but it feels safe to conclude that people picked the week after Christmas for vacations more than the one before the holiday.
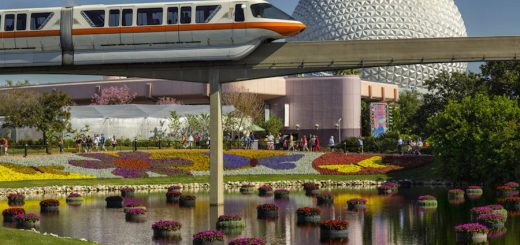
EPCOT
I actually cheated with this one yesterday and looked up the data for my January trip, which I may have to cancel due to air travel issues.
So, here’s the data, which I will discuss afterward:
- Frozen Ever After – 98 minutes, down 14
- Test Track – 69 minutes, down 12
- Soarin’ Around the World – 50 minutes, down 7
- Mission: SPACE – 35 minutes, down 13
- Spaceship Earth – 31 minutes, down 7
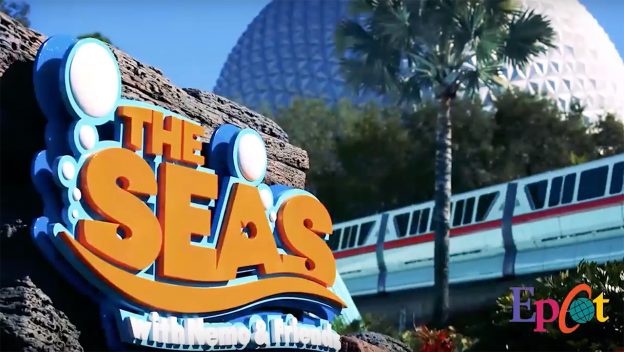
- The Seas with Nemo & Friends – 25 minutes, down 11
- Journey into Imagination with Figment – 16 minutes, down 6
- Gran Fiesta Tour Starring the Three Caballeros – 15 minutes, down 6
- Living with the Land – 14 minutes, down 4
- Turtle Talk with Crush – 10 minutes, down 5
Overall – and against all previous data – the average EPCOT attraction required a wait of 36 minutes, down eight minutes from Christmas Week.
This seems like a good time to mention that the EPCOT International Festival of the Holidays ended on December 30th.
Yes, festivals do have that kind of impact on the popularity of EPCOT on a given day. Even so, this park’s behavior flies in the face of the first two parks.
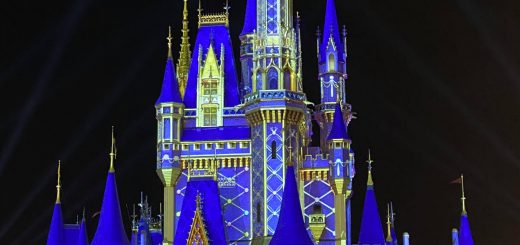
Magic Kingdom
Given the anomaly of EPCOT, we must wonder what Magic Kingdom did. Here’s the data:
- Seven Dwarfs Mine Train – 111 minutes, up 9
- Peter Pan’s Flight – 97 minutes, up 15
- Jungle Cruise – 89 minutes, up 9
- Space Mountain – 73 minutes, up 10
- Big Thunder Mountain Railroad – 63 minutes, up 10
- Haunted Mansion – 63 minutes, up 9
- Splash Mountain – 59 minutes, down 5
- Buzz Lightyear’s Space Ranger Spin – 57 minutes, up 10
- Pirates of the Caribbean – 55 minutes, up 7
- Astro Orbiter – 49 minutes, up 4
- The Many Adventures of Winnie the Pooh – 47 minutes, up 5
- It’s a Small World – 45 minutes, up 2
- Under the Sea ~ Journey of the Little Mermaid – 42 minutes, up 4
- Tomorrowland Speedway – 41 minutes, up 6
- The Barnstormer – 40 minutes, up 5
- Dumbo the Flying Elephant – 38 minutes, up 5
- The Magic Carpets of Aladdin – 36 minutes, up 3
- Princess Fairytale Hall – 31 minutes, up 5
- Tomorrowland Transit Authority PeopleMover – 29 minutes, up 4
- Mad Tea Party – 26 minutes, up 6
- Monsters, Inc. Laugh Floor – 24 minutes, up 3
- Mickey’s PhilharMagic – 23 minutes, up 5
- Prince Charming Regal Carrousel – 21 minutes, up 3
- Country Bear Jamboree – 15 minutes, up 2
- Town Square Theatre – 14 minutes, up 5
- Walt Disney’s Carousel of Progress – 7 minutes, up 2
Yes, every attraction increased its wait time except for Splash Mountain. And yes, that one only decreased due to the colder weather.
Overall, guests waited an average of 47 minutes for Magic Kingdom attractions, an increase of seven minutes from Christmas Week.
Final Thoughts
If you ever wonder how important festivals are to EPCOT, herein lies your proof.
Literally every other non-wet ride at Walt Disney World increased its wait time the week after Christmas.
Humorously, this data won’t help us at all during the holidays in 2022 since the calendar configuration will change.
Christmas Eve/Christmas and New Year’s Eve/New Year’s Day fall on Saturday/Sunday this year. So, the behavior should be somewhat similar but still not identical.