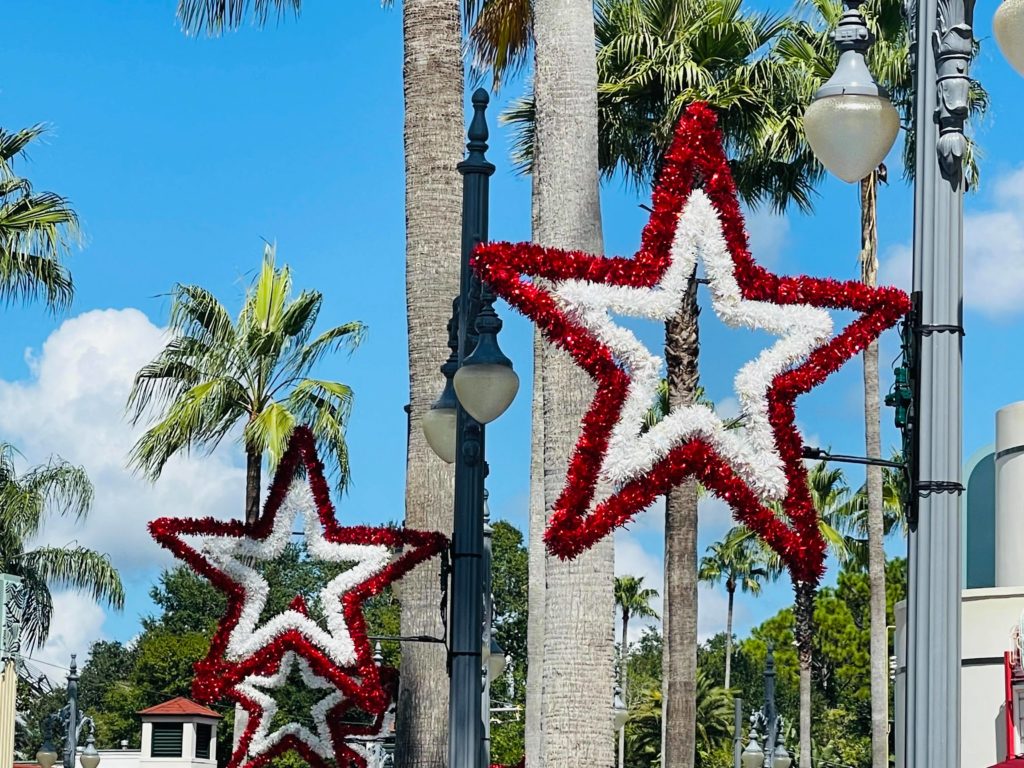
Walt Disney World Wait Times for Christmas Week 2021

Let’s start with the obvious. Christmas Week at Walt Disney World is historically the busiest time on the annual calendar.
The only other holiday that even approaches Christmas Week is July 4th. Ergo, the crowd sizes over the past week were abnormally large.
In truth, they represent close to the theoretical limits of what Disney fans should expect in terms of standing in line.
Here are the wait times for Christmas Week 2021! Spoilers: They’re not much different from last week!
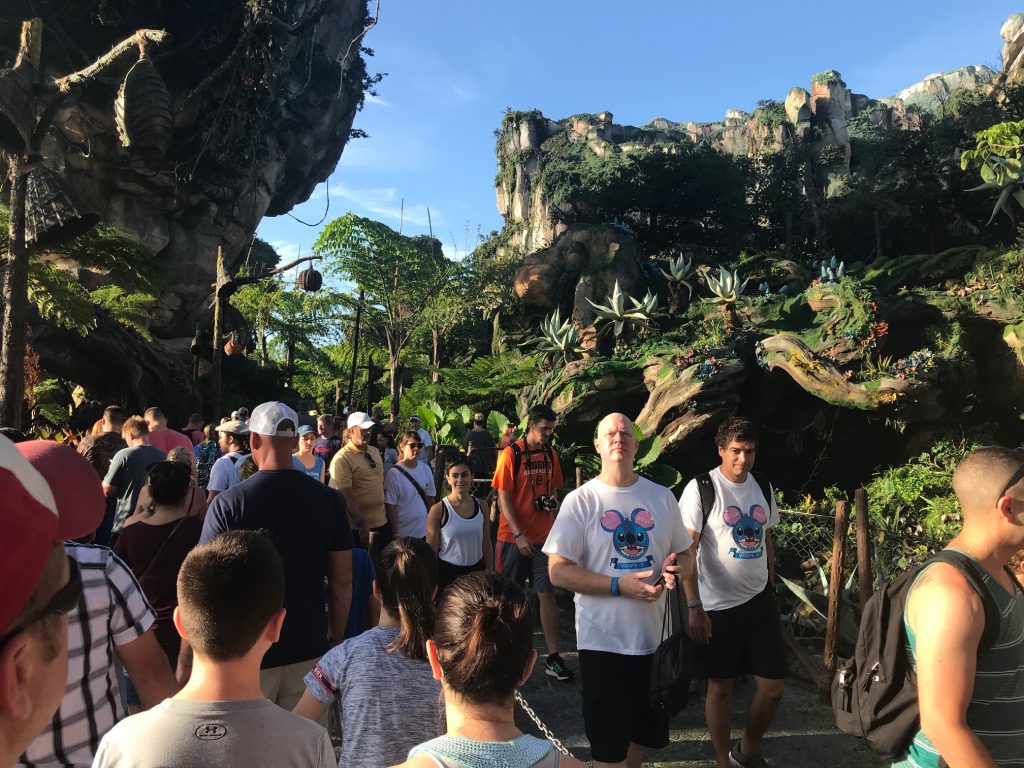
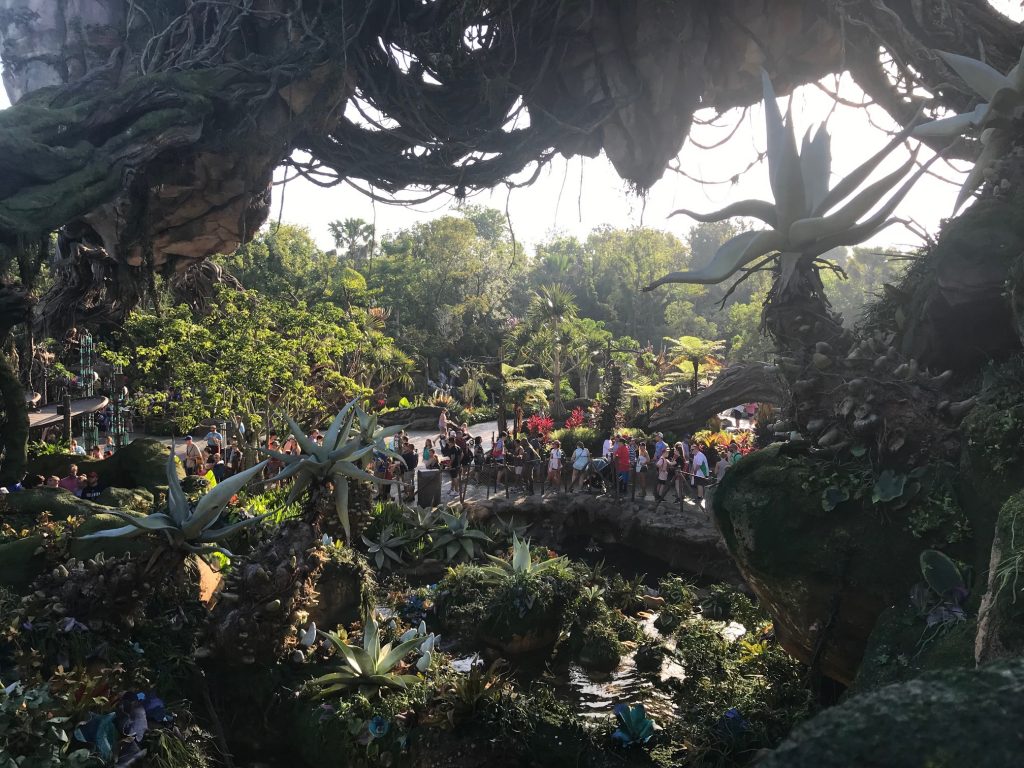
Disney’s Animal Kingdom
Last time, Avatar Flight of Passage was honestly as bad as I’d expected. It was “only” 161 minutes.
I’m not even saying that tongue-in-cheek. Yes, waiting in line for more than two and a half hours for an attraction is INSANE.
Still, I once waited at least four hours for Top Thrill Dragster during its opening week, and that ride takes like 20 seconds. So…
Anyway, Avatar Flight of Passage averaged just 141 minutes for Christmas Week. So, it went down 20 minutes!
This seems like a good time to mention that Disney switched its Lightning Lane/Disney Genie+ options for two weeks.
I suspect that played a factor in attraction line size distributions. Does my theory hold? Here’s the rest of Animal Kingdom for consideration:
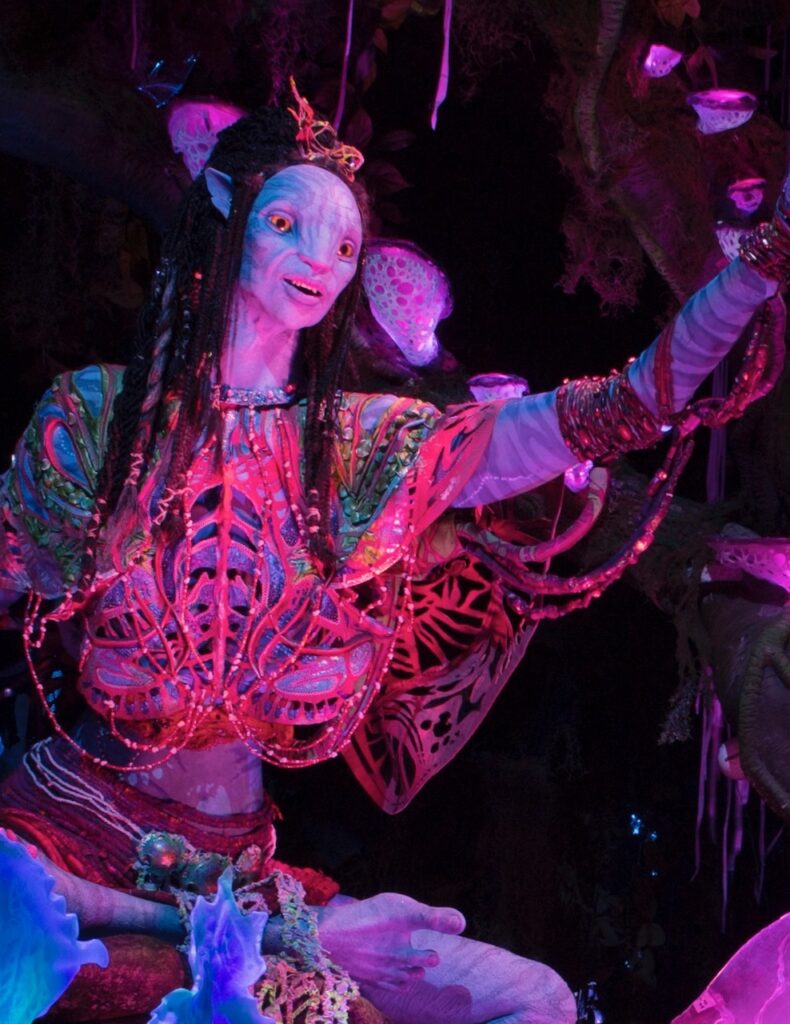
- Na’vi River Journey – 78 minutes, up 6
- Kilimanjaro Safaris – 71 minutes, up 11
- DINOSAUR – 48 minutes, up 3
- Expedition Everest – 40 minutes, down 10
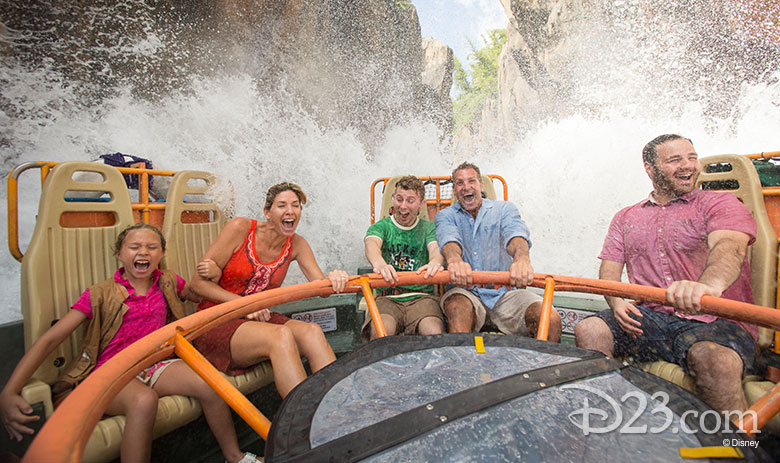
- Kali River Rapids – 40 minutes, up 25
- TriceraTop Spin – 20 minutes, down 2
- It’s Tough to Be a Bug! – 18 minutes, down 2
(Kent Phillips, photographer)
Okay, the most intriguing number here is Expedition Everest. That’s the ride that temporarily changed from Lightning Lane to Disney Genie+.
This move does appear to have positively impacted its wait time.
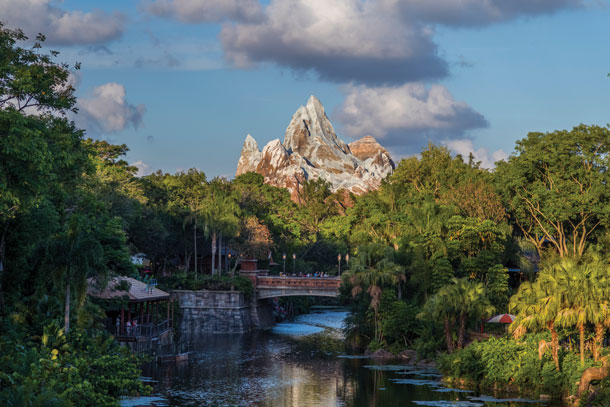
Photo: Disney
Conversely, the warmer weather in Florida last week led to renewed interest in Kali River Rapids.
Generally, that ride isn’t super-popular at the end of December for…reasons. Usually, most guests are just happy that they’re dressed in layers.
Overall, the average Animal Kingdom attraction required a wait of 56 minutes, the same as last time!
Folks, this is going great!

Photo: Disney
Disney’s Hollywood Studios
Of course, here’s where everything could go wrong.
After all, guests demonstrate the most patience standing in line at Star Wars: Rise of the Resistance.
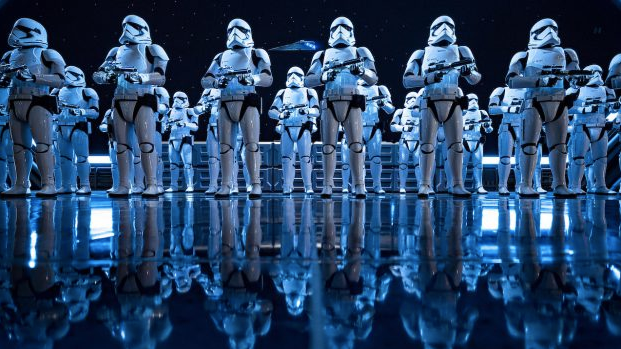
Photo: Disney
Last time, the average wait here reached 155 minutes. For Christmas Week, that number basically stayed the same at 154 minutes.
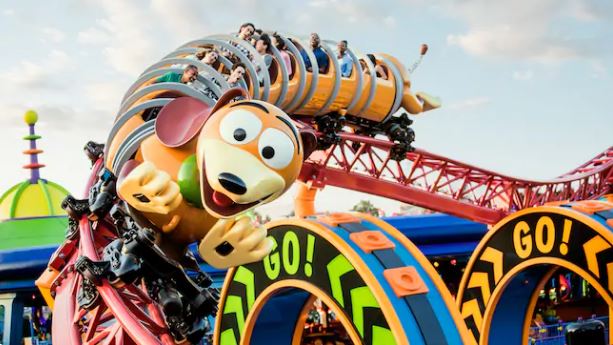
The second-longest lines happened at Slinky Dog Dash, and again, the news is positive. Slinky Dog Dash actually fell slightly from 105 to 100 minutes.
Credit: Disney
Hmm, I’m starting to think that pre-Christmas Week involved longer waits in 2021. That would be…unusual.
Here are the rest of Hollywood Studios’s attractions for comparison:
- Millennium Falcon: Smugglers Run – 75 minutes, down 6
- Mickey & Minnie’s Runaway Railway – 67 minutes, down 2
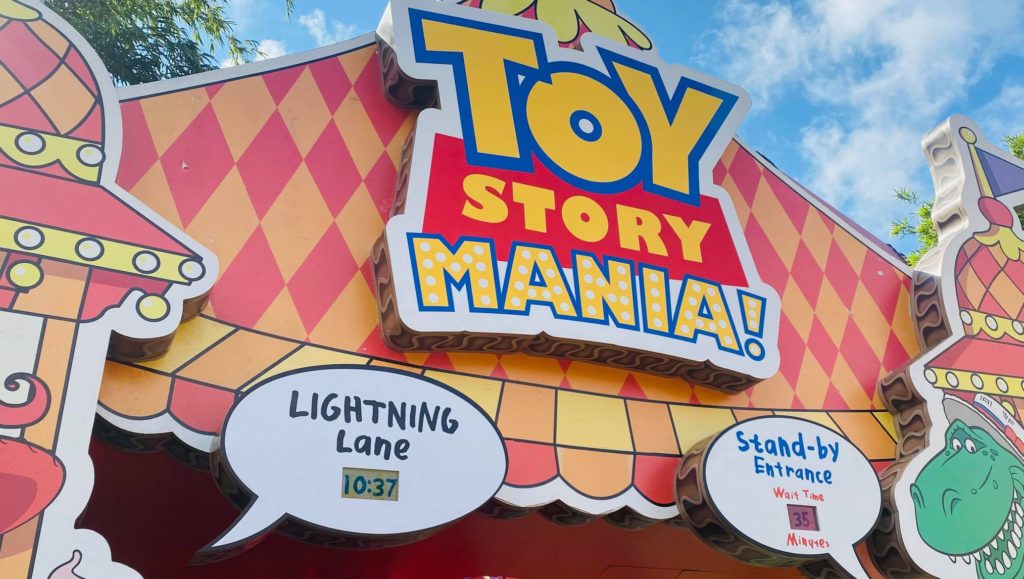
- Toy Story Mania! – 66 minutes, up 1
- Rock ‘N’ Roller Coaster Starring Aerosmith – 65 minutes, down 6
- Twilight Zone Tower of Terror – 55 minutes, down 5
- Alien Swirling Saucers – 40 minutes, down 2
- Star Tours – The Adventures Continue – 31 minutes, down 1
- Lightning McQueen’s Racing Academy – no change
- Muppet*Vision 3D – 10 minutes, no change
Overall, this is very good news. The average Hollywood Studios ride required a wait of 51 minutes, down a minute from last time.
The ride here that temporarily changed from Lightning Lane to Disney Genie+ is Runaway Railway.
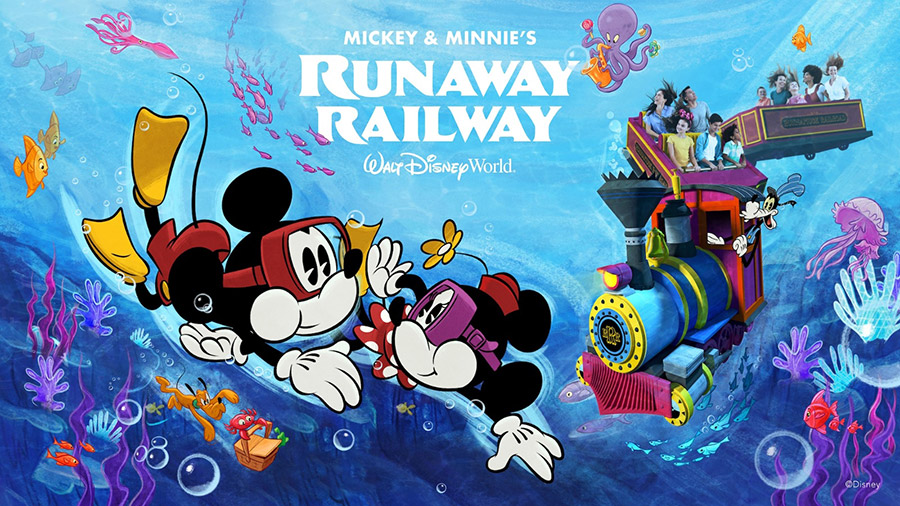
That move seems to have had modest ripple effects elsewhere. For this reason, I suspect that Disney may extend these changes beyond early January.
EPCOT
By the way, one other factor in play here is calendar configuration.
You undoubtedly noticed that Christmas Eve/New Year’s Eve and Christmas/New Year’s fall on Friday/Saturday in 2021.
When the holidays happen in mid-week, people must choose whether to stay before or afterward.
This year, we may be seeing more people showing up the week before Christmas and then not sticking around for New Year’s.
We can and will track this next week.
Here are the EPCOT wait times to throw into the mix:
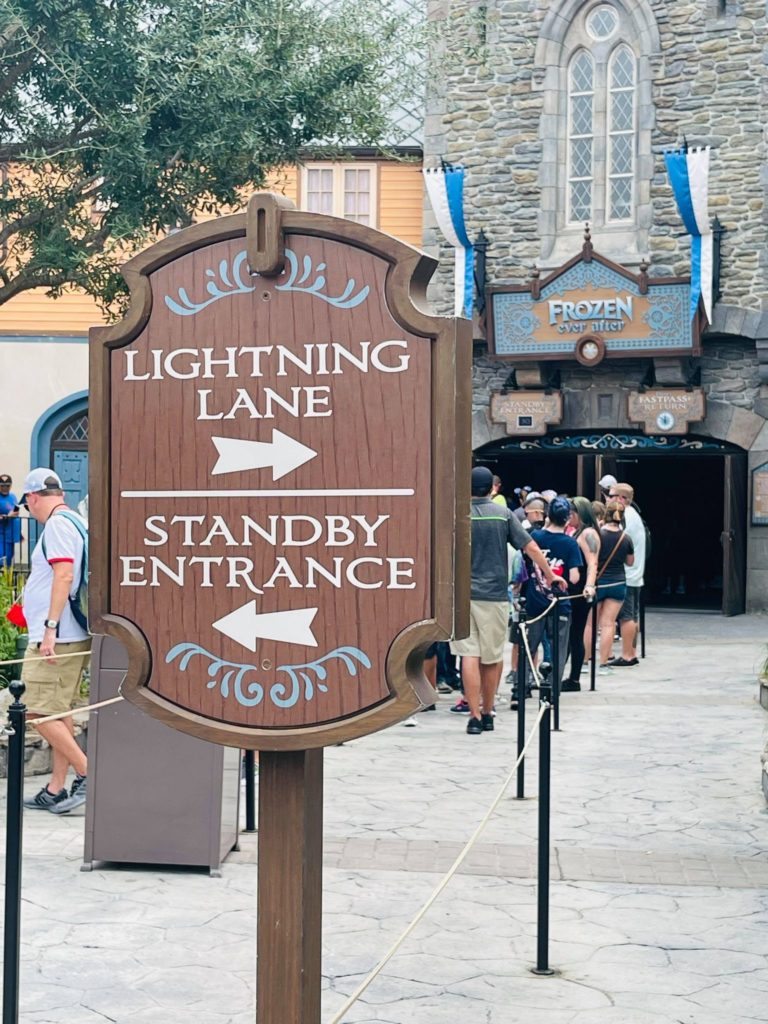
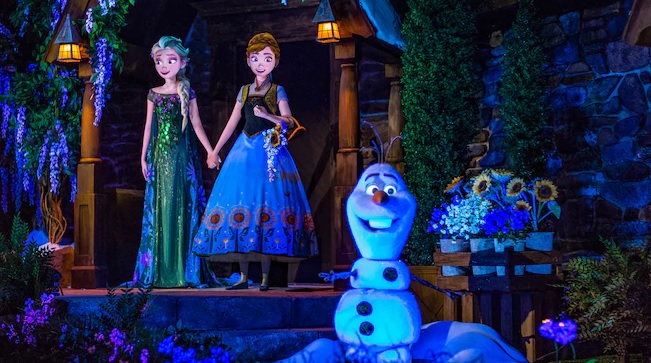
- Frozen Ever After – 112 minutes, up 10
- Test Track – 81 minutes, up 2
- Soarin’ Around the World – 57 minutes, down 3
- Mission: SPACE – 48 minutes, up 3
- Spaceship Earth – 37 minutes, up 2
- The Seas with Nemo & Friends – 36 minutes, up 9
- Journey into Imagination with Figment – 22 minutes, down 1
- Gran Fiesta Tour Starring the Three Caballeros – 21 minutes, up 2
- Living with the Land – 18 minutes, down 2
- Turtle Talk with Crush – 15 minutes, up 1
The average EPCOT attraction involved a wait of 44 minutes, up two minutes.
Frozen Ever After is the temporary Disney Genie+ ride here. That indisputably had an impact.
Credit: Disney
Still, I believe there’s something to the argument that we’ve reached the theoretical upper boundary of wait times during the Park Pass era.
Magic Kingdom
Okay, let’s talk about the Lightning Lane attractions before we lump in everything else.
Seven Dwarfs Mine Train averaged a 102-minute wait, down four minutes from last time.
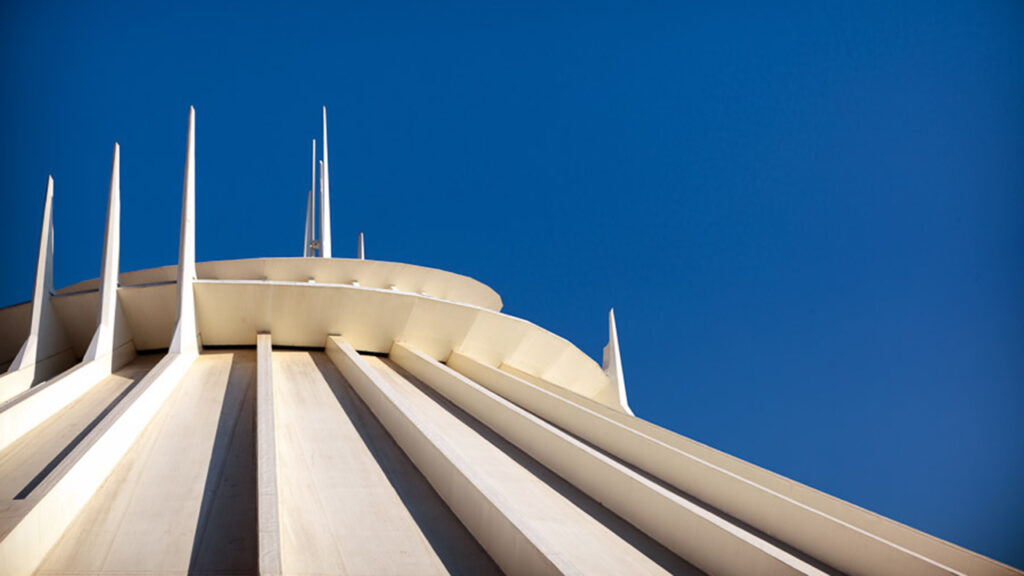
The once and future Lightning Lane attraction, Space Mountain, required a 63-minute wait on average. That’s up five minutes from pre-Christmas Week.
Here’s the rest of Magic Kingdom:
- Peter Pan’s Flight – 82 minutes, down 9
- Jungle Cruise – 80 minutes, down 6
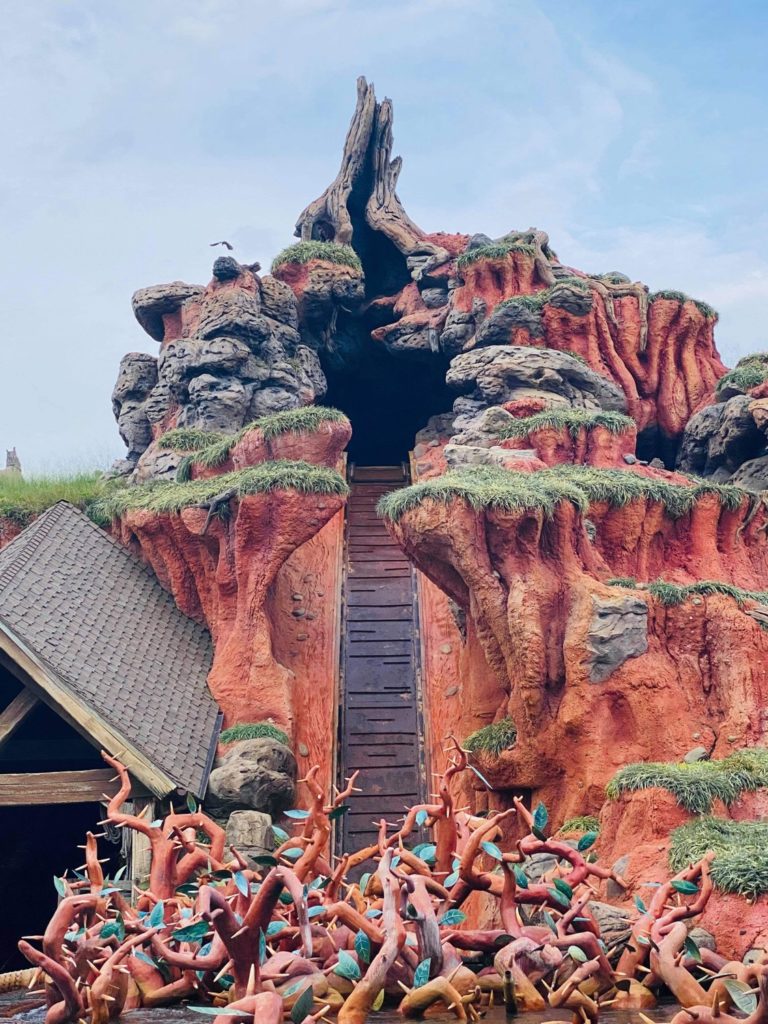
- Splash Mountain – 64 minutes, up 22
- Haunted Mansion – 54 minutes, up 1
- Big Thunder Mountain Railroad – 53 minutes, up 2
- Pirates of the Caribbean – 48 minutes, up 9
- Buzz Lightyear Space Ranger Spin – 47 minutes, no change
- Astro Orbiter – 45 minutes, down 1
- It’s a Small World – 43 minutes, up 3
- The Many Adventures of Winnie the Pooh – 42 minutes, down 1
- Under the Sea ~ Journey of the Little Mermaid – 38 minutes, up 6
- The Barnstormer – 35 minutes, up 4
- Tomorrowland Speedway – 35 minutes, up 5
- Dumbo the Flying Elephant – 33 minutes, up 4
- Magic Carpets of Aladdin – 33 minutes, up 4
- Princess Fairytale Hall – 26 minutes, up 2
- Tomorrowland Transit Authority PeopleMover – 25 minutes, up 3
- Monsters, Inc. Laugh Floor – 21 minutes, no change
- Mad Tea Party – 20 minutes, up 1
- Mickey’s PhilharMagic – 18 minutes, down 2
- Prince Charming Regal Carrousel – 18 minutes, down 1
- Country Bear Jamboree – 13 minutes, up 7
- Town Square Theatre – 9 minutes, down 2
- Walt Disney’s Carousel of Progress – 5 minutes, down 2
The average Magic Kingdom attraction required a wait of 40 minutes, up two minutes from last time.
So, there you have it. These should be the longest wait times we track until Spring Break or possibly even July!