Walt Disney World Wait Times for July 4th Holiday Week
Whenever I discuss the worst times to visit Walt Disney World, I mention one date in particular. It’s July 4th, a time when the parks are hot and crowded.
People love to spend the holiday week at Walt Disney World, with historical data suggesting it’s among the most populous single dates on the calendar.
The only other dates even close to July 4th occur during Thanksgiving and Christmas week.
I’m warning you in advance. You should expect this week’s Disney wait times to be looooong. Were they? Well…
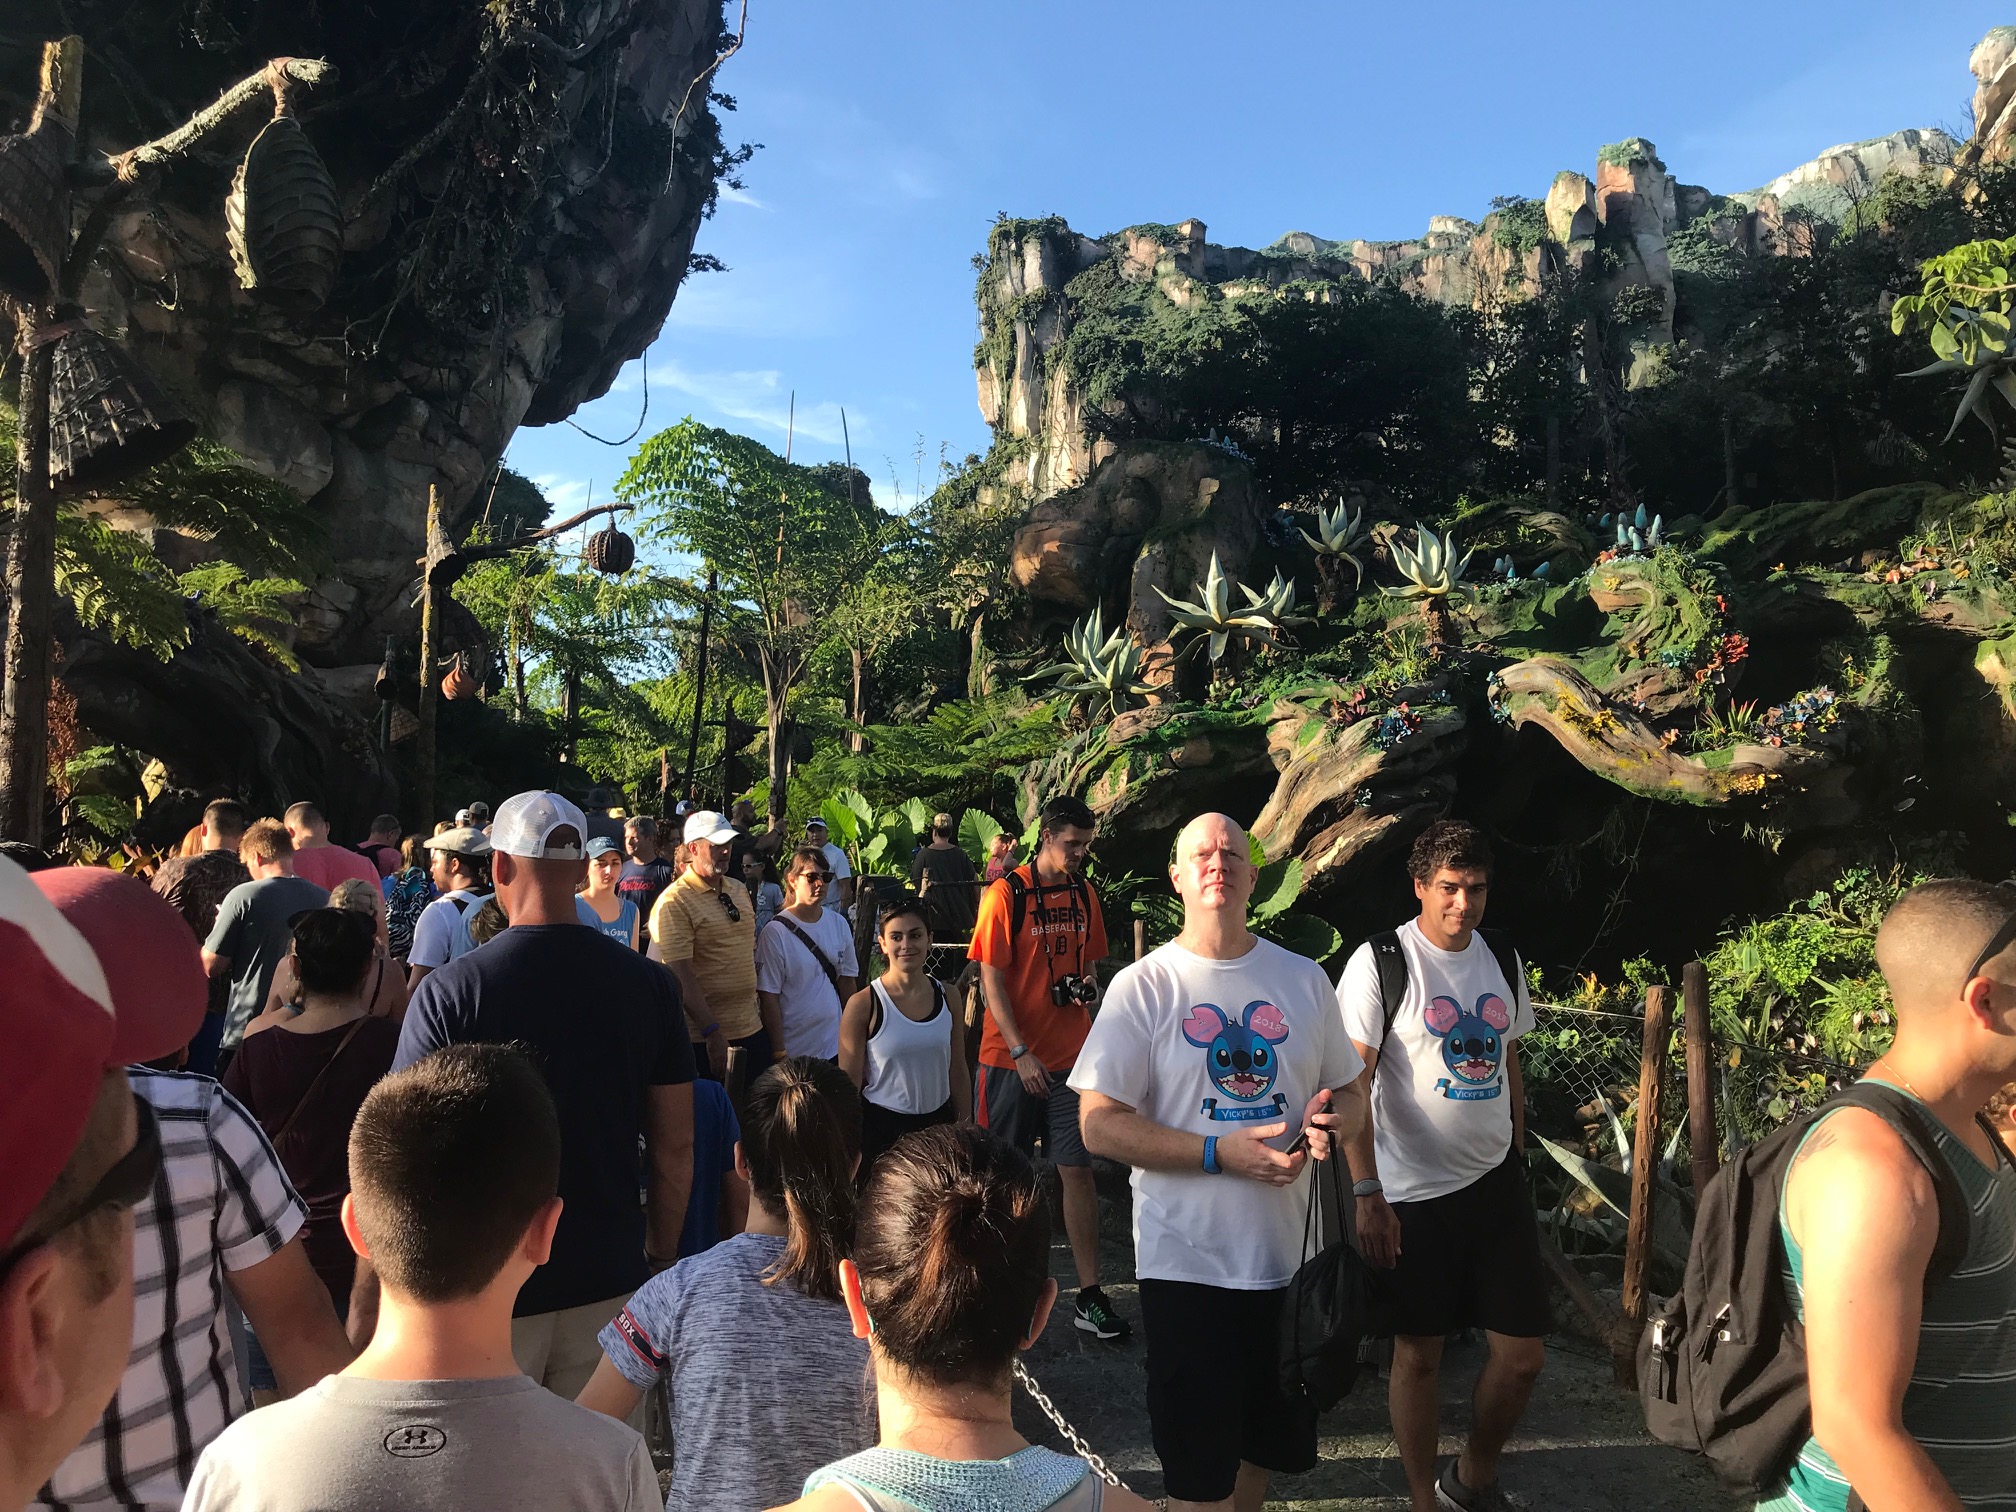
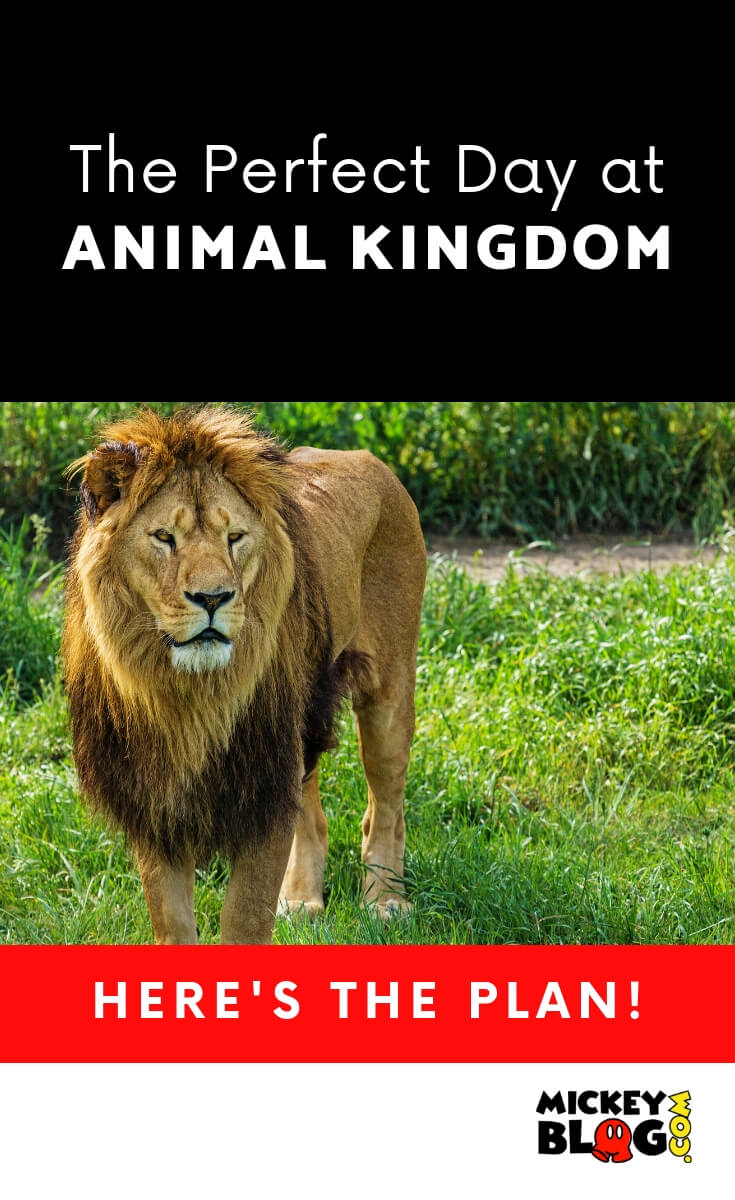
Disney’s Animal Kingdom
This park hosts one of the three most popular rides at Walt Disney World. So, it’s a solid bellwether to identify how heavy overall park congestion was.
Well, Avatar Flight of Passage required 113 minutes in line, one of the most prolonged waits we’ve tracked while doing this article.
The holiday weekend led to an average wait increase of 21 minutes, which is more than 20 percent.
Thankfully, the rest of the park didn’t suffer similar spikes. Most times increased but not by THAT much.

Realistically, this development makes sense. If you’re going to Animal Kingdom during the July 4th holiday, you’re riding Avatar Flight of Passage no matter what.
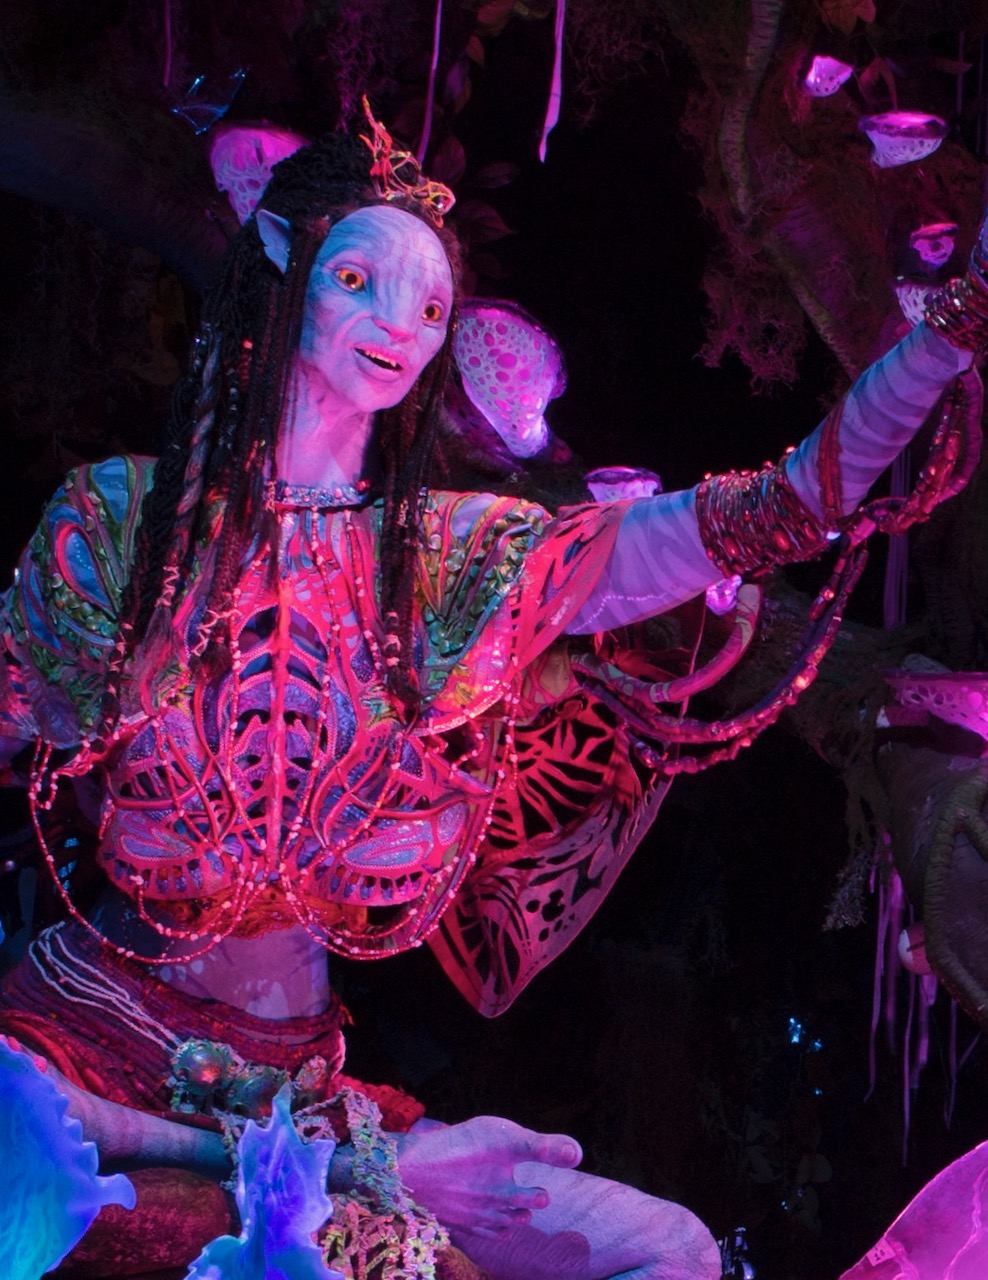
The second-longest ride was Pandora’s other jewel, Na’vi River Journey, which went up from 46 to 52 minutes.
(Kent Phillips, photographer)
The other two attractions with longer than normal waits were Kilimanjaro Safaris at 50 minutes, up 14 minutes, and Kali River Rapids, up nine minutes.
Again, these changes are understandable, as the July heat leads to a surge at the park’s best wet ride.
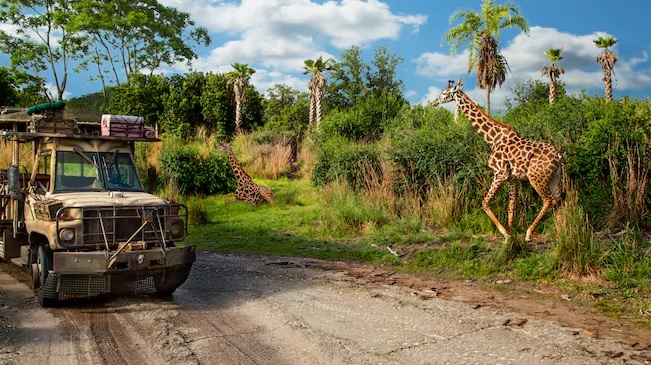
Photo: Disney
Plus, an increase in traffic at Animal Kingdom naturally boosts its anchor attraction, the safari ride.
Everything thus far seems reasonable due to holiday crowds. What about the others? Here’s the data:
- Expedition Everest – 35 minutes, down three
- DINOSAUR – 31 minutes, up six
- It’s Tough to Be a Bug! – 17 minutes, up four
- TriceraTop Spin – 10 minutes, up two
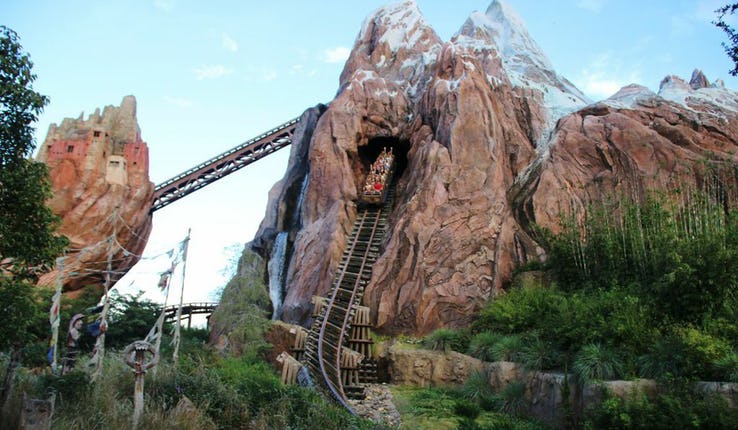
Image Credit: Disney
So, there’s nothing scary here, just expected behavior. Frankly, I’d braced for worse, although Avatar Flight of Passage is rough at a nearly two-hour wait.
Overall, the average Animal Kingdom ride had a wait of 45 minutes, although Avatar Flight of Passage skews the picture.
 Disney’s Hollywood Kingdom
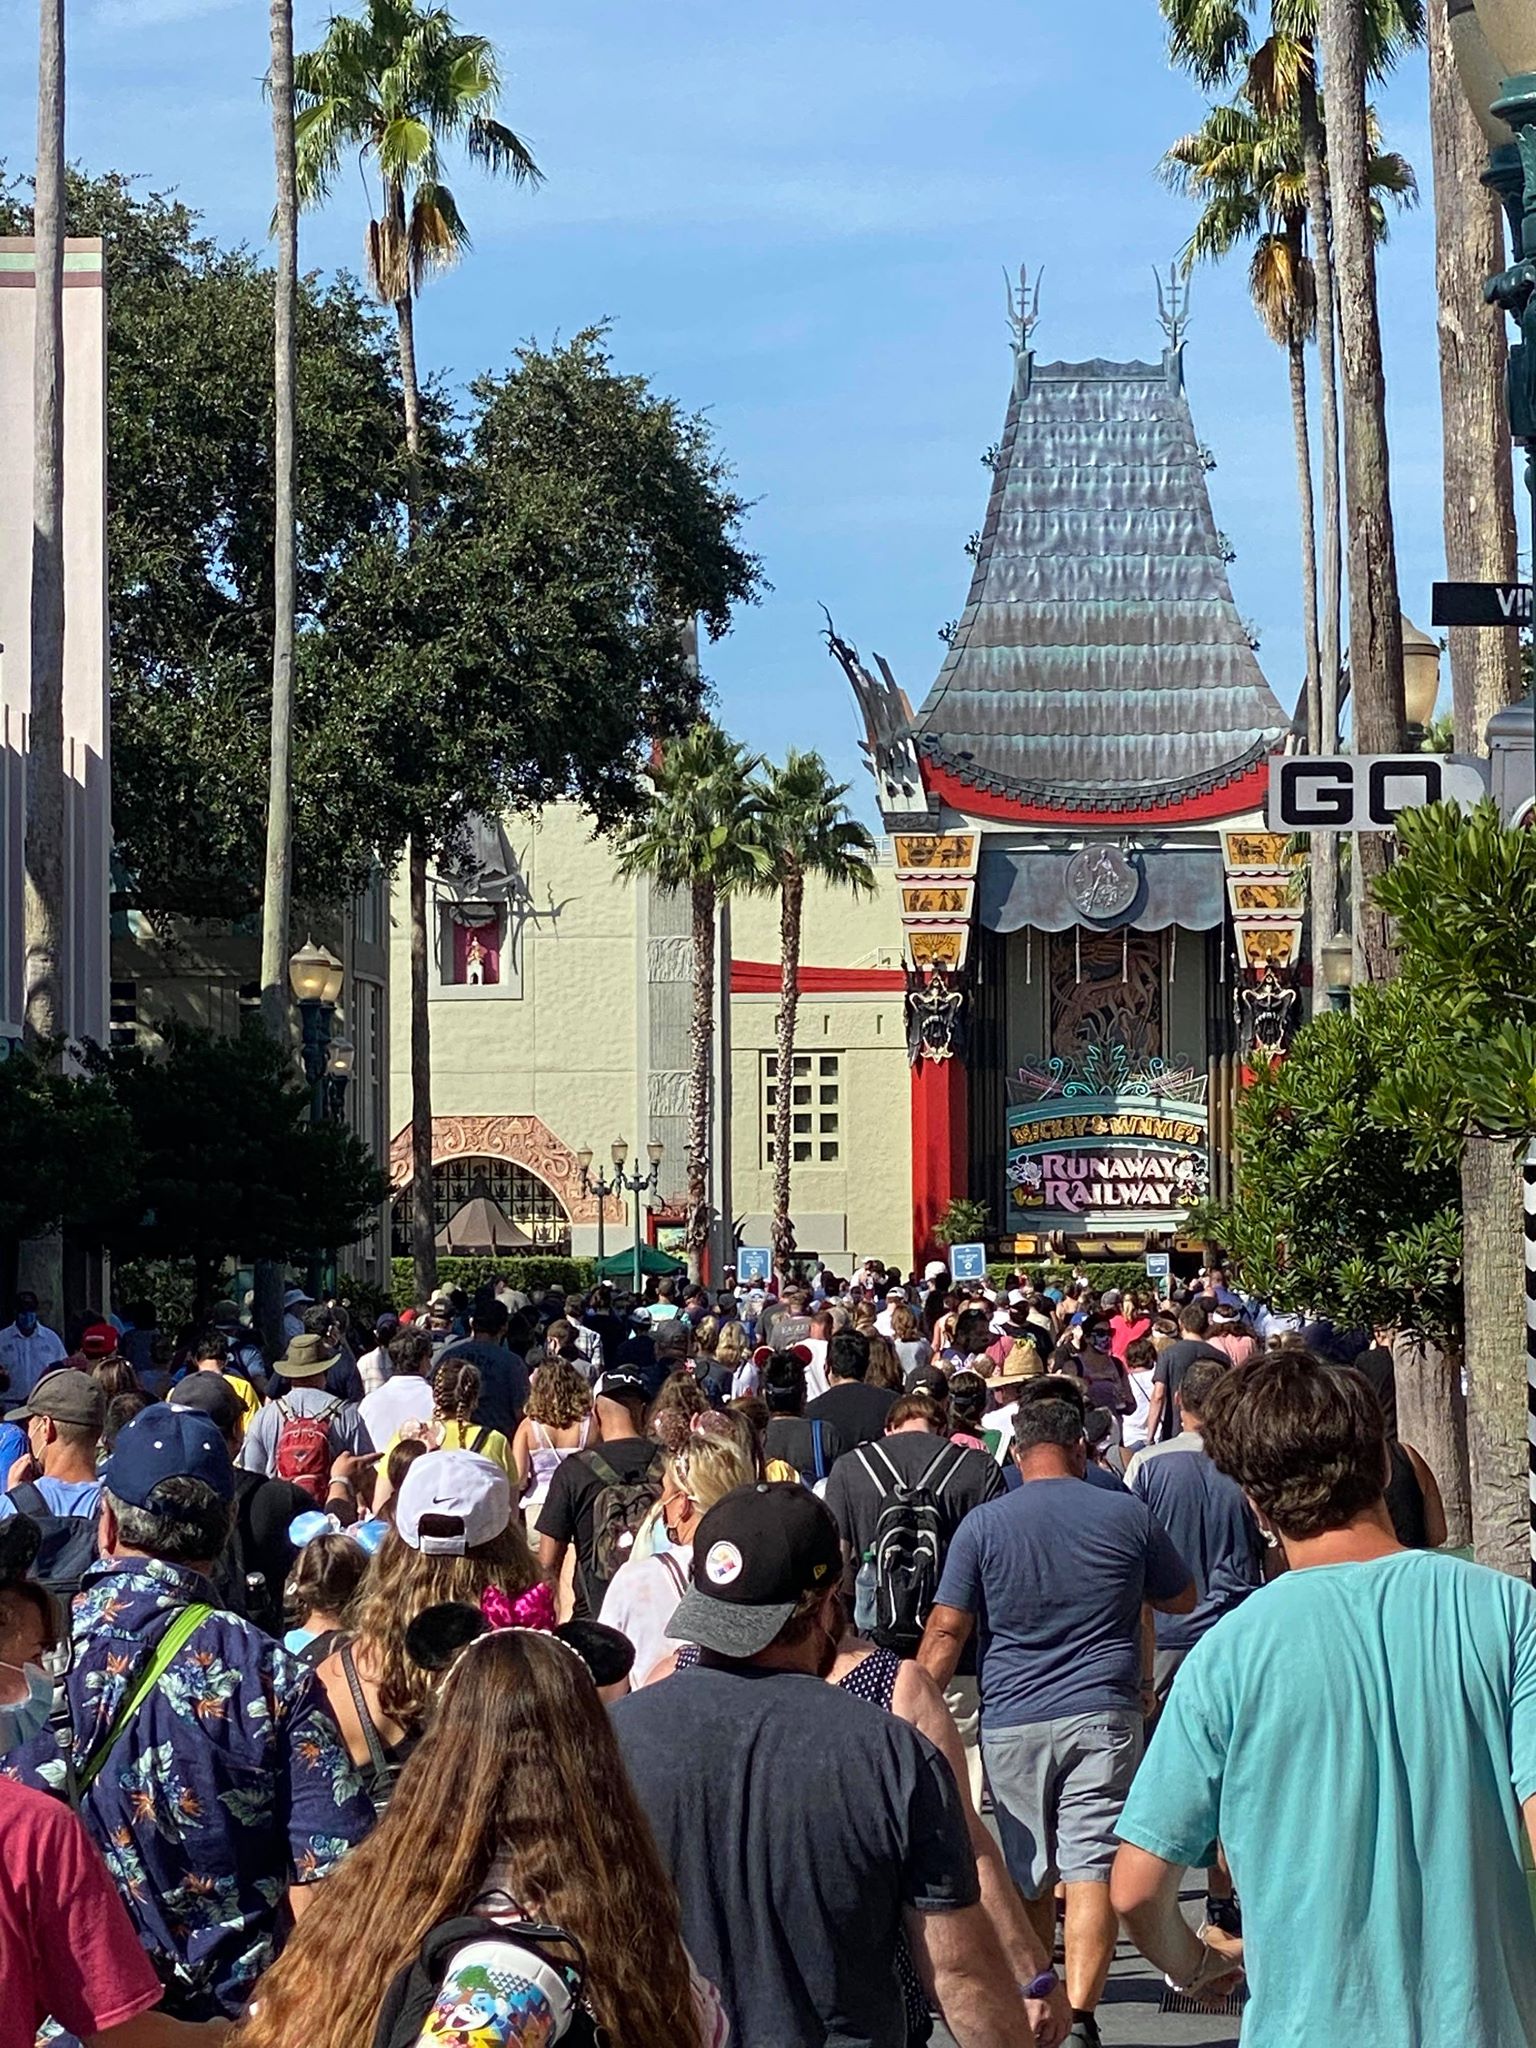
If any park would have felt the holiday pinch the most, it’s Hollywood Studios. After all, this park claims the largest crowds per ride on most days.
The holiday weekend proved no exception, as most line queues remained overflowing. However, nothing was up an egregious amount.
For example, Slinky Dog Dash maintained an 89-minute wait, technically down a minute from last week.
Millennium Falcon: Smugglers Run required 65 minutes, up two from the previous week.
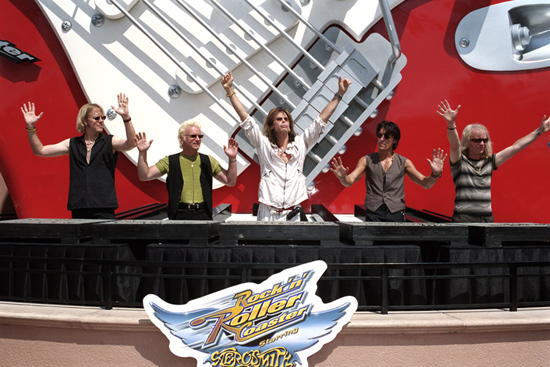
Rock ‘n’ Roller Coaster Starring Aerosmith similarly held at 60 minutes, virtually the same as last week.
Here are the others, which are largely stagnant:
- Mickey and Minnie’s Runaway Railway – 58 minutes, up three
- Twilight Zone Tower of Terror – 50 minutes, no change
- Toy Story Mania! – 48 minutes, no change
- Alien Swirling Saucers – 37 minutes, up four
- Star Tours: The Adventures Continue – 23 minutes, up two
- Lightning McQueen’s Racing Academy – 15 minutes, up five
- Muppet*Vision 3D – 12 minutes, no change
So, this park proved quite reasonable over the holidays, all things considered.
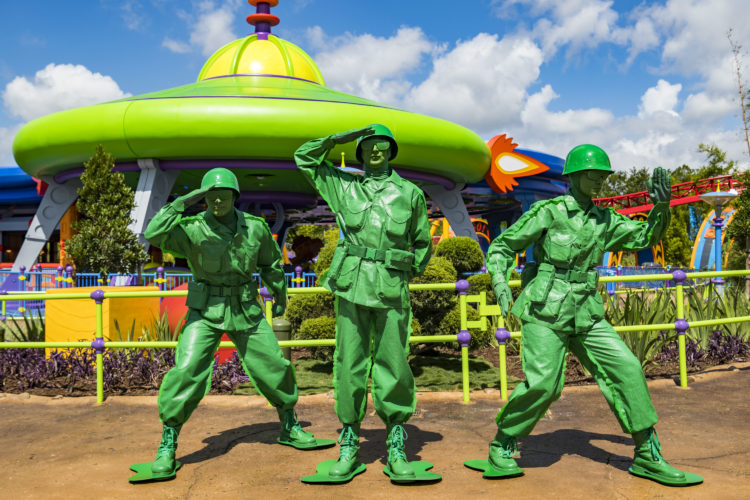
Photo: Matt Stroshane
The average Hollywood Studios attraction came with a wait of 41 minutes over the holidays.
EPCOT
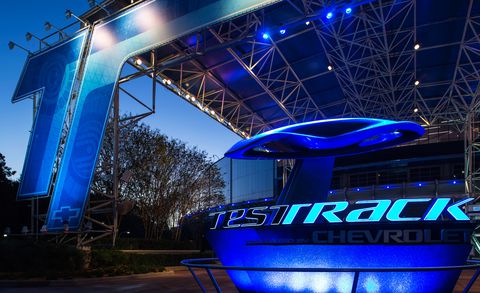
As usual, Test Track required the longest time in line, although it actually decreased two minutes to 67.
Frozen Ever After counteracted that by going up two minutes to 47. So, you would have waited the same amount as last week to ride both.
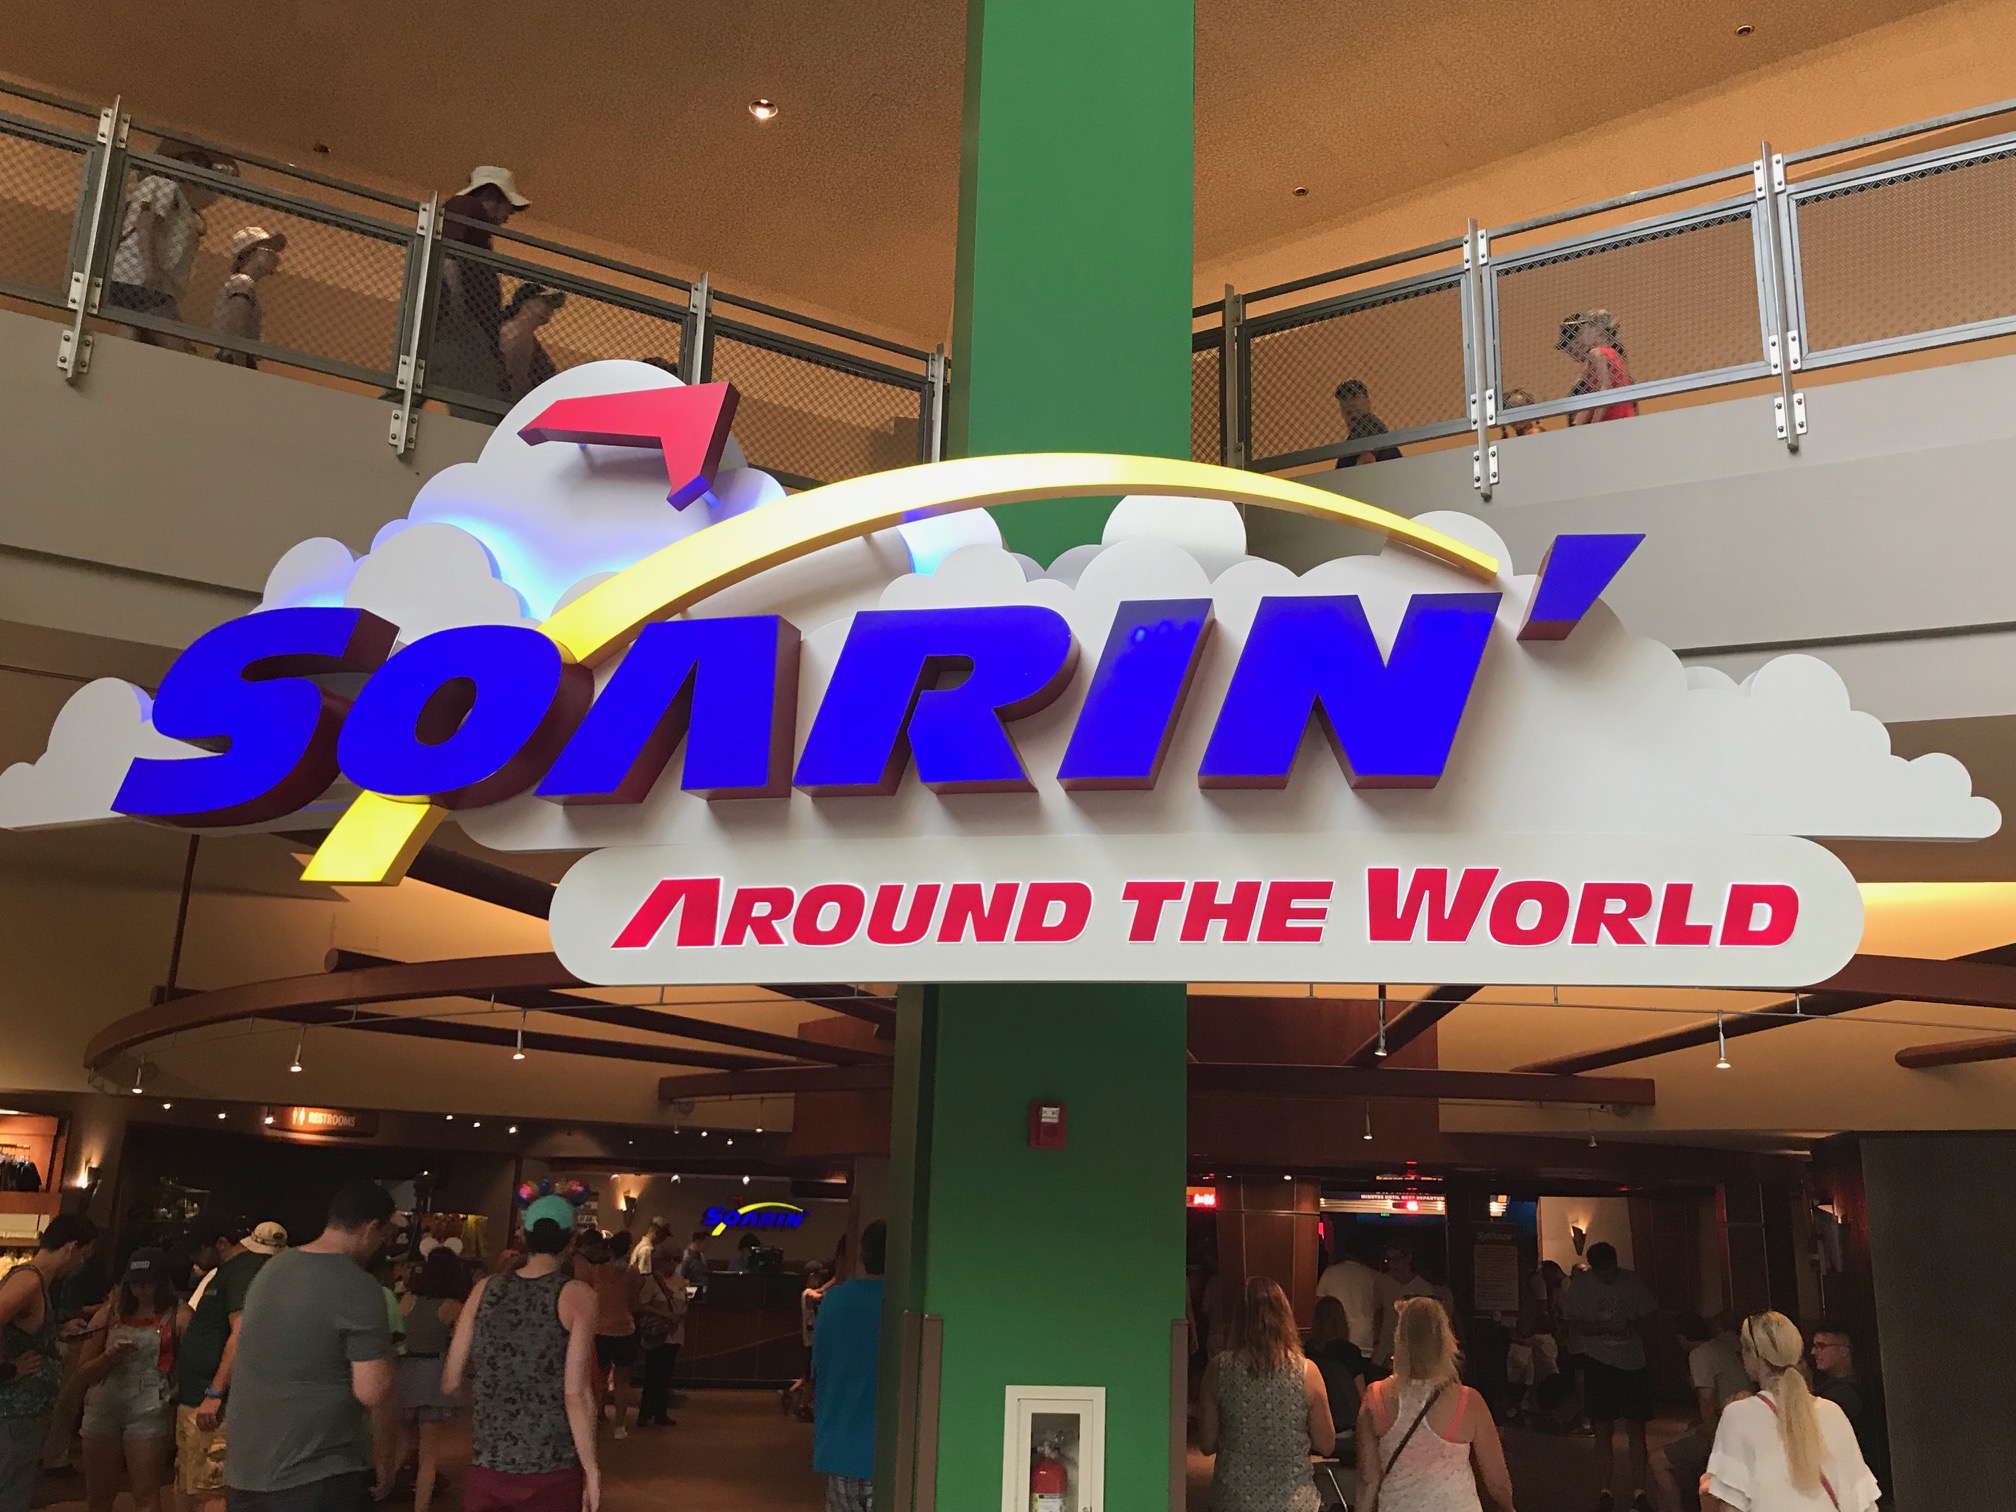
Soarin’ fell from 38 to 30 minutes, which must have seemed spectacular to everyone visiting the parks over the holidays. That’s a steal!
Here are the other EPCOT attractions:
- Mission: SPACE – 29 minutes, up two
- Spaceship Earth – 24 minutes, up four
- Gran Fiesta Tour Starring the Three Caballeros – 23 minutes, down five
- The Seas with Nemo & Friends – 16 minutes, no change
- Living with the Land – 14 minutes, up two
- Journey into Imagination with Figment – 13 minutes, down one
Overall, you’d have spent 28 minutes in line for the average EPCOT attraction, which is actually down one from the previous week.
As usual, this park provided tremendous bang for the buck.
Magic Kingdom
Okay, Magic Kingdom generally works as the litmus test for overall park crowds. Here’s what we saw from the lines:
- Seven Dwarfs Mine Train – 69 minutes, up four
- Splash Mountain – 60 minutes, no change
- Jungle Cruise – 50 minutes, no change
- Space Mountain – 49 minutes, no change
- Peter Pan’s Flight – 48 minutes, up one
- Haunted Mansion – 41 minutes, down three
- Astro Orbiter – 38 minutes, down one
- Buzz Lightyear’s Space Ranger Spin – 34 minutes, no change
- The Adventures of Winnie the Pooh – 34 minutes, up one
- It’s a Small World – 33 minutes, up seven
- Pirates of the Caribbean – 32 minutes, up three
- Big Thunder Mountain Railroad – 32 minutes, down one
- Under the Sea ~ Journey of the Little Mermaid – 28 minutes, up five
- Dumbo the Flying Elephant – 23 minutes, up five
- Tomorrowland Speedway – 23 minutes, up seven
- They Barnstormer – 21 minutes, up six
- Tomorrowland Transit Authority PeopleMover – 19 minutes, up four
- Magic Carpets of Aladdin – 19 minutes, up five
- Prince Charming Regal Carrousel – 17 minutes, up seven
- Mickey’s PhilharMagic – 16 minutes, up three
- Mad Tea Party – 14 minutes, no change
- Walt Disney’s Carousel of Progress – 5 minutes, no change
- Country Bear Jamboree – 4 minutes, down four
So, the trend here is pretty easy to track. The high-end attractions generally kept their standard wait times.
Impatient park guests flocked to the less trafficked rides instead. So, those attractions mostly experienced bumps up in wait times.
Overall, the average Magic Kingdom attraction required a 32-minute wait, up a modest three minutes from last week.
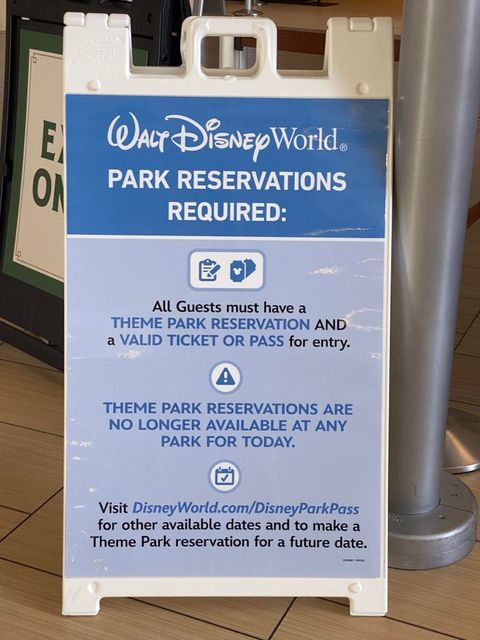
I’ll be honest that I was braced for much worse due to the July 4th holiday rush. Disney Park Passes are doing their job in terms of crowd control.