Disney Wait Times for the Third Week of June 2021
We’ve officially started the summer at Disney theme parks, a time when kids are on summer vacation.
So, families enjoy more freedom to travel, and all paths lead to the Happiest Place on Earth!
Last week, we noticed some unusual behavior. Did that trend continue? Let’s examine the Disney wait times for the third week of June!
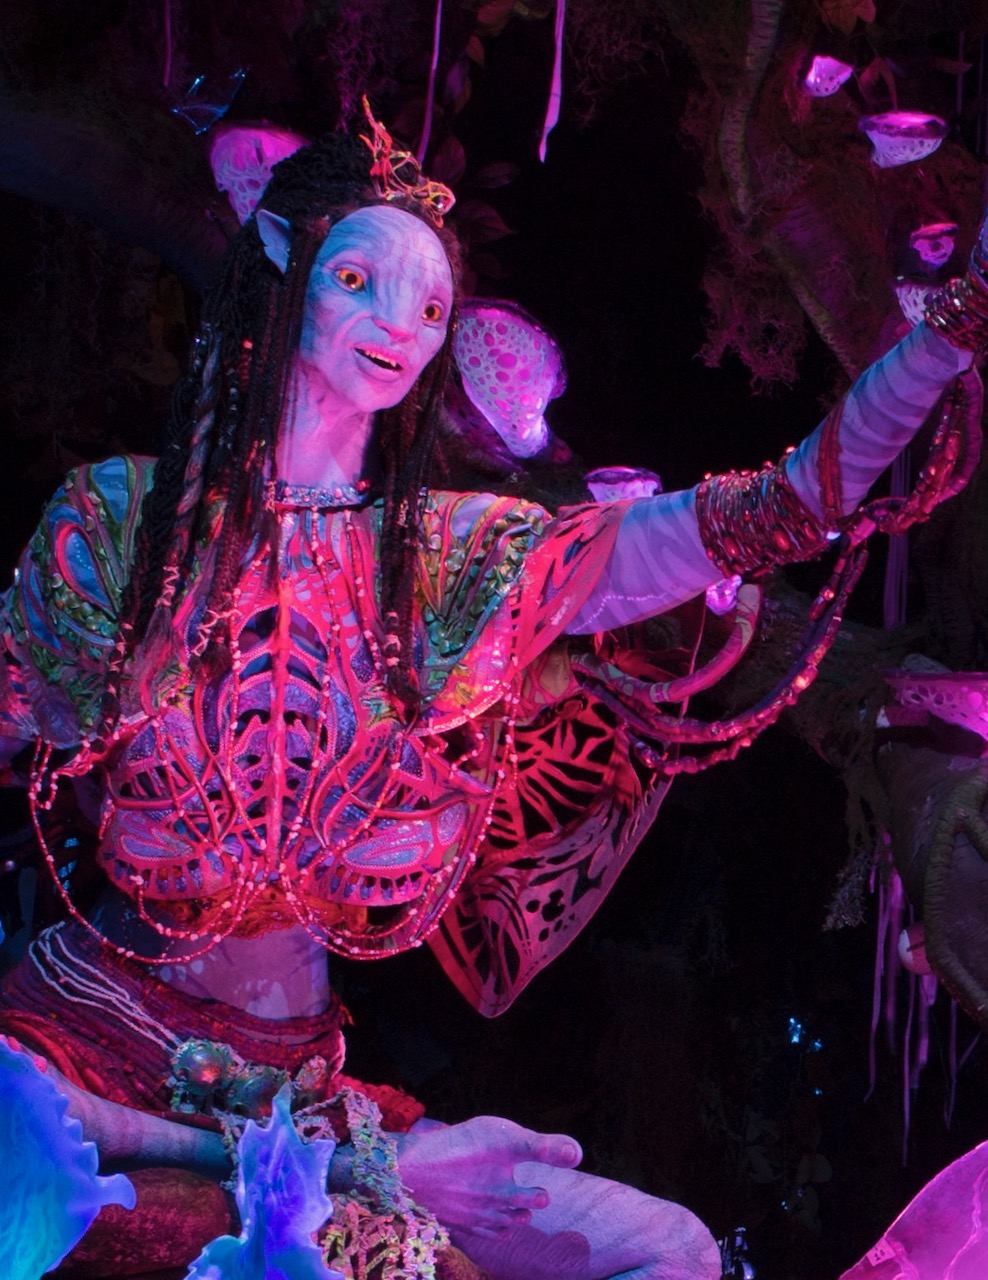
Disney’s Animal Kingdom
I mentioned last time that this park suffered two different power outages that could have led to increased wait times. Did that prove true?
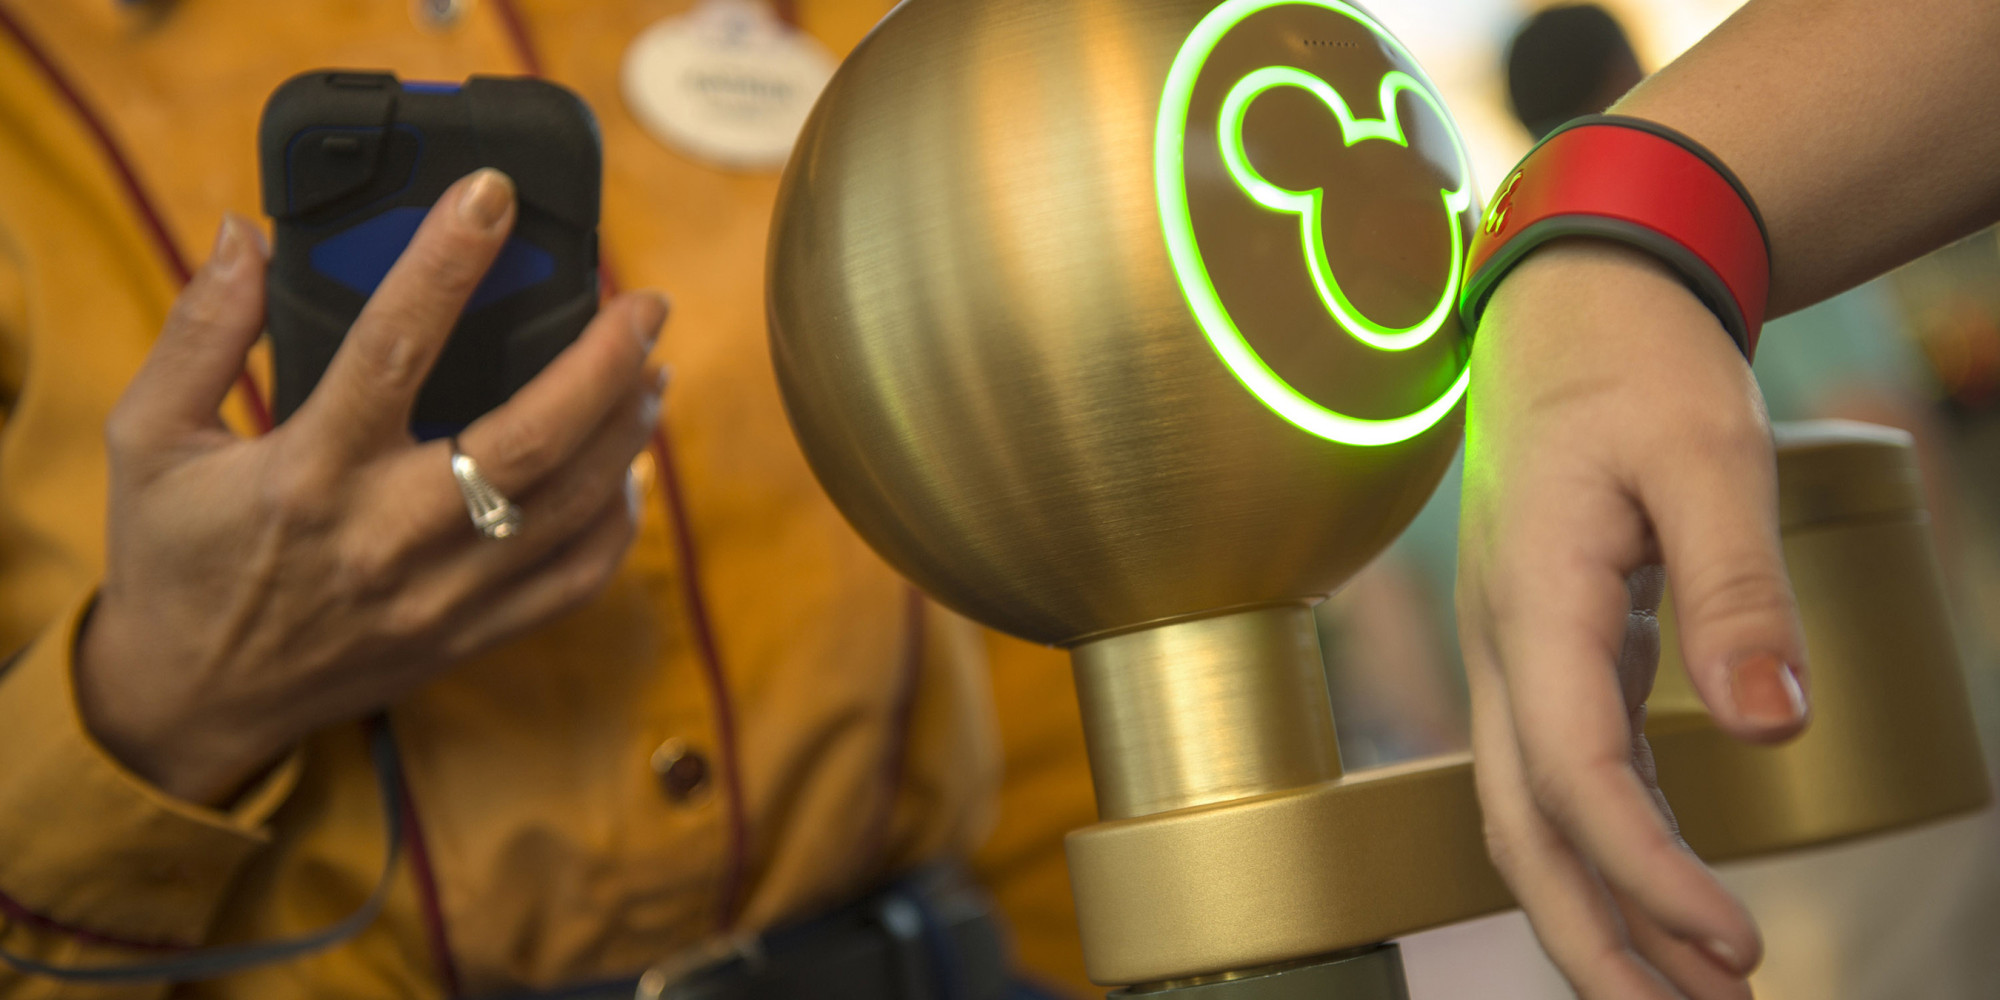
(Kent Phillips, photographer)
Here’s the average wait time for all Animal Kingdom attractions:
- Avatar Flight of Passage (71 minutes, down three)
- Na’Vi River Journey (41 minutes, no change)
- Kali River Rapids (36 minutes, down four)
- Kilimanjaro Safaris (28 minutes, down two)
- Expedition Everest (22 minutes, down six)
- DINOSAUR (18 minutes, down eight)
- It’s Tough to Be a Bug! (ten minutes, down five)
- TriceraTop Spin (six minutes, no change)
Okay, that data seems emphatic. Everything at Animal Kingdom either stayed the same or went down a few minutes.
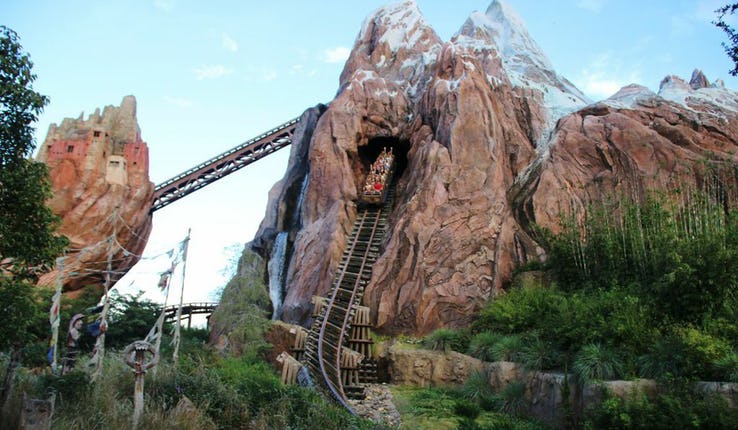
Image Credit: Disney
I think it’s fair to conclude that the power outages led to temporary wait time increases. Now that Disney has kept the lights on, everything is back to normal.
Overall, the average Animal Kingdom attraction required 28 minutes in line, down seven minutes (or 20 percent) from last week.
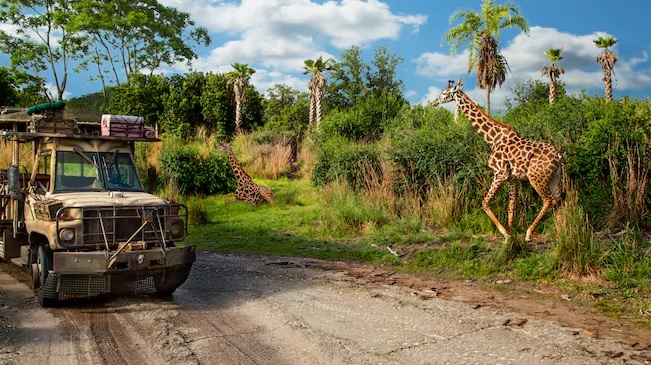
Photo: Disney
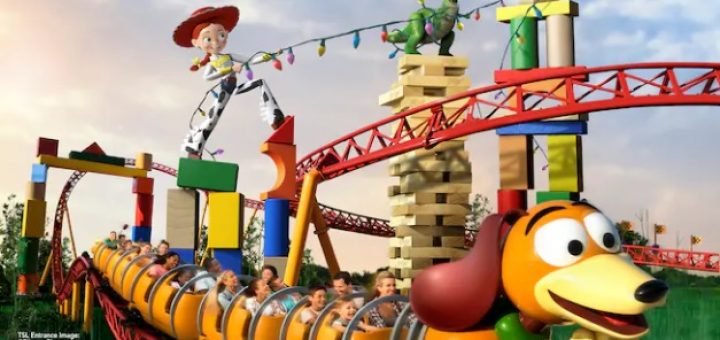
Disney’s Hollywood Studios
While Animal Kingdom’s behavior makes sense given its unique circumstances, we should accept that it’s summer now.
Also, the pandemic has subsided, allowing cabin fever-crazy tourists to flock to theme parks. So, overall theme park attendance is way up.
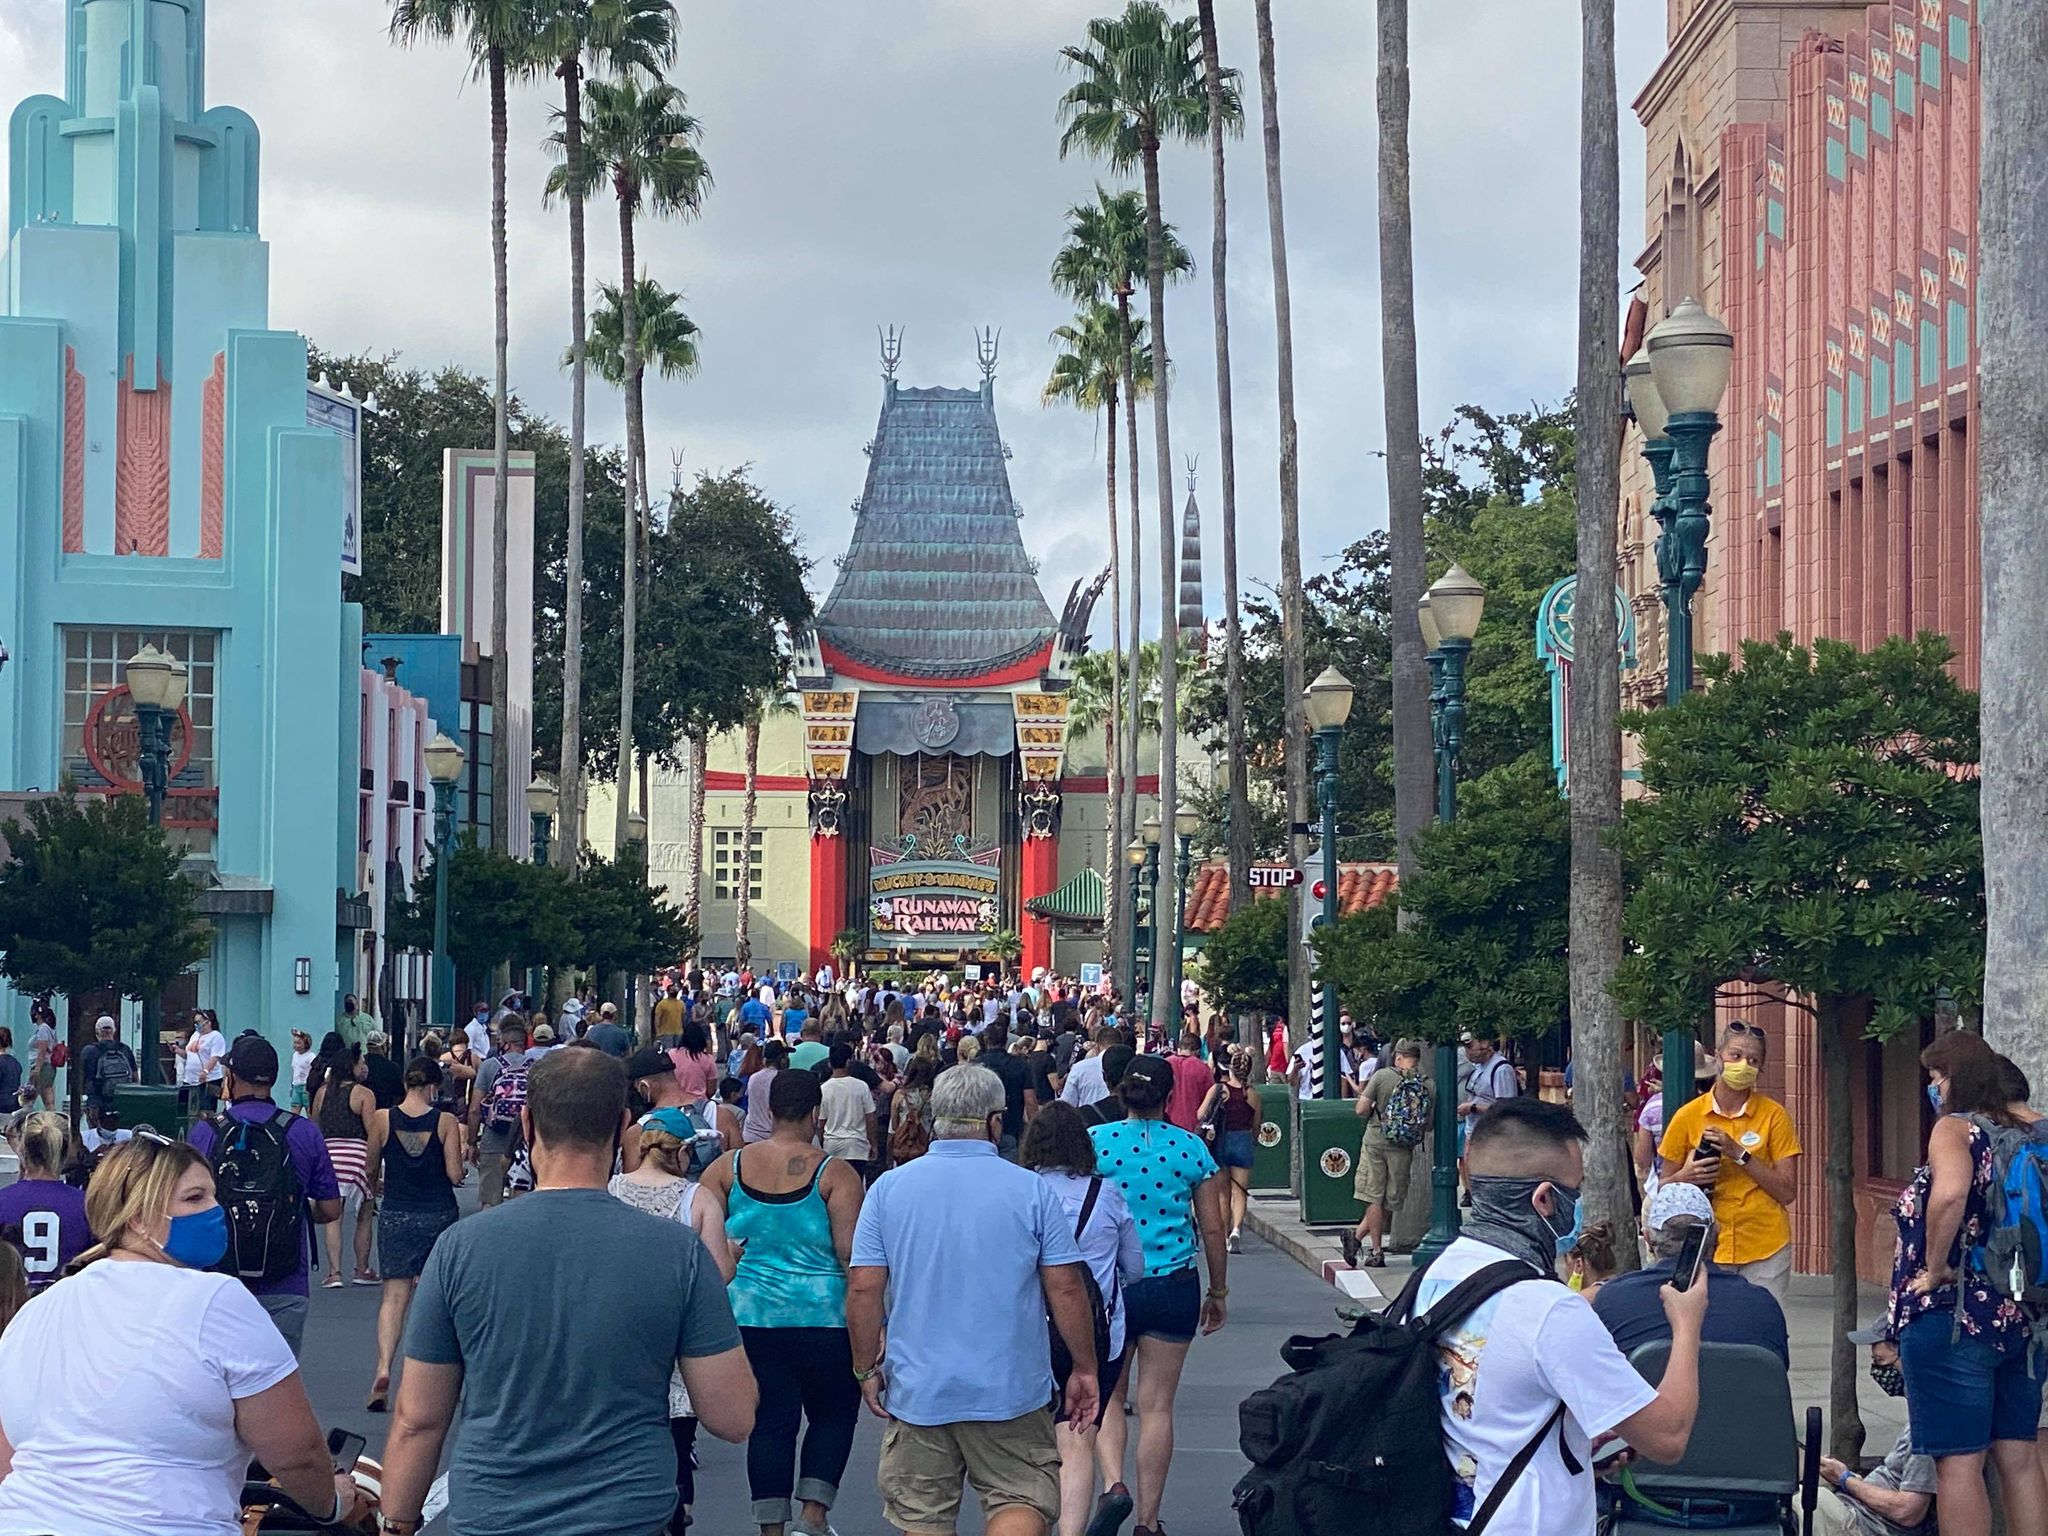
As such, we should expect wait times to increase at Disney. And that’s what happened at Hollywood Studios.
Last time, the average ride required a 32-minute wait. This past week, it increased to 34 minutes.
Yes, that’s a modest increase but also a slightly upward trend. Here are the specifics:
- Slinky Dog Dash (79 minutes, no change)
- Millennium Falcon: Smugglers Run (55 minutes, up three)
- Rock ‘n’ Roller Coaster Starring Aerosmith (52 minutes, up three)
- Mickey & Minnie’s Runaway Railway (50 minutes, up five)
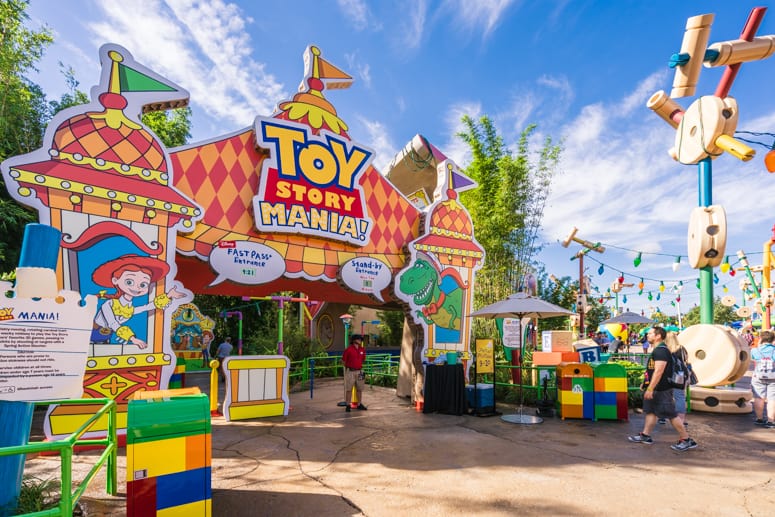
- Toy Story Mania! (40 minutes, no change)
- Twilight Zone Tower of Terror (34 minutes, up two)
- Alien Swirling Saucers (28 minutes, no change)
- Star Tours – The Adventures Continue (16 minutes, up two)
- Lightning McQueen’s Racing Academy (15 minutes, unlisted)
- Muppet*Vision 3D (12 minutes, no change)
EPCOT
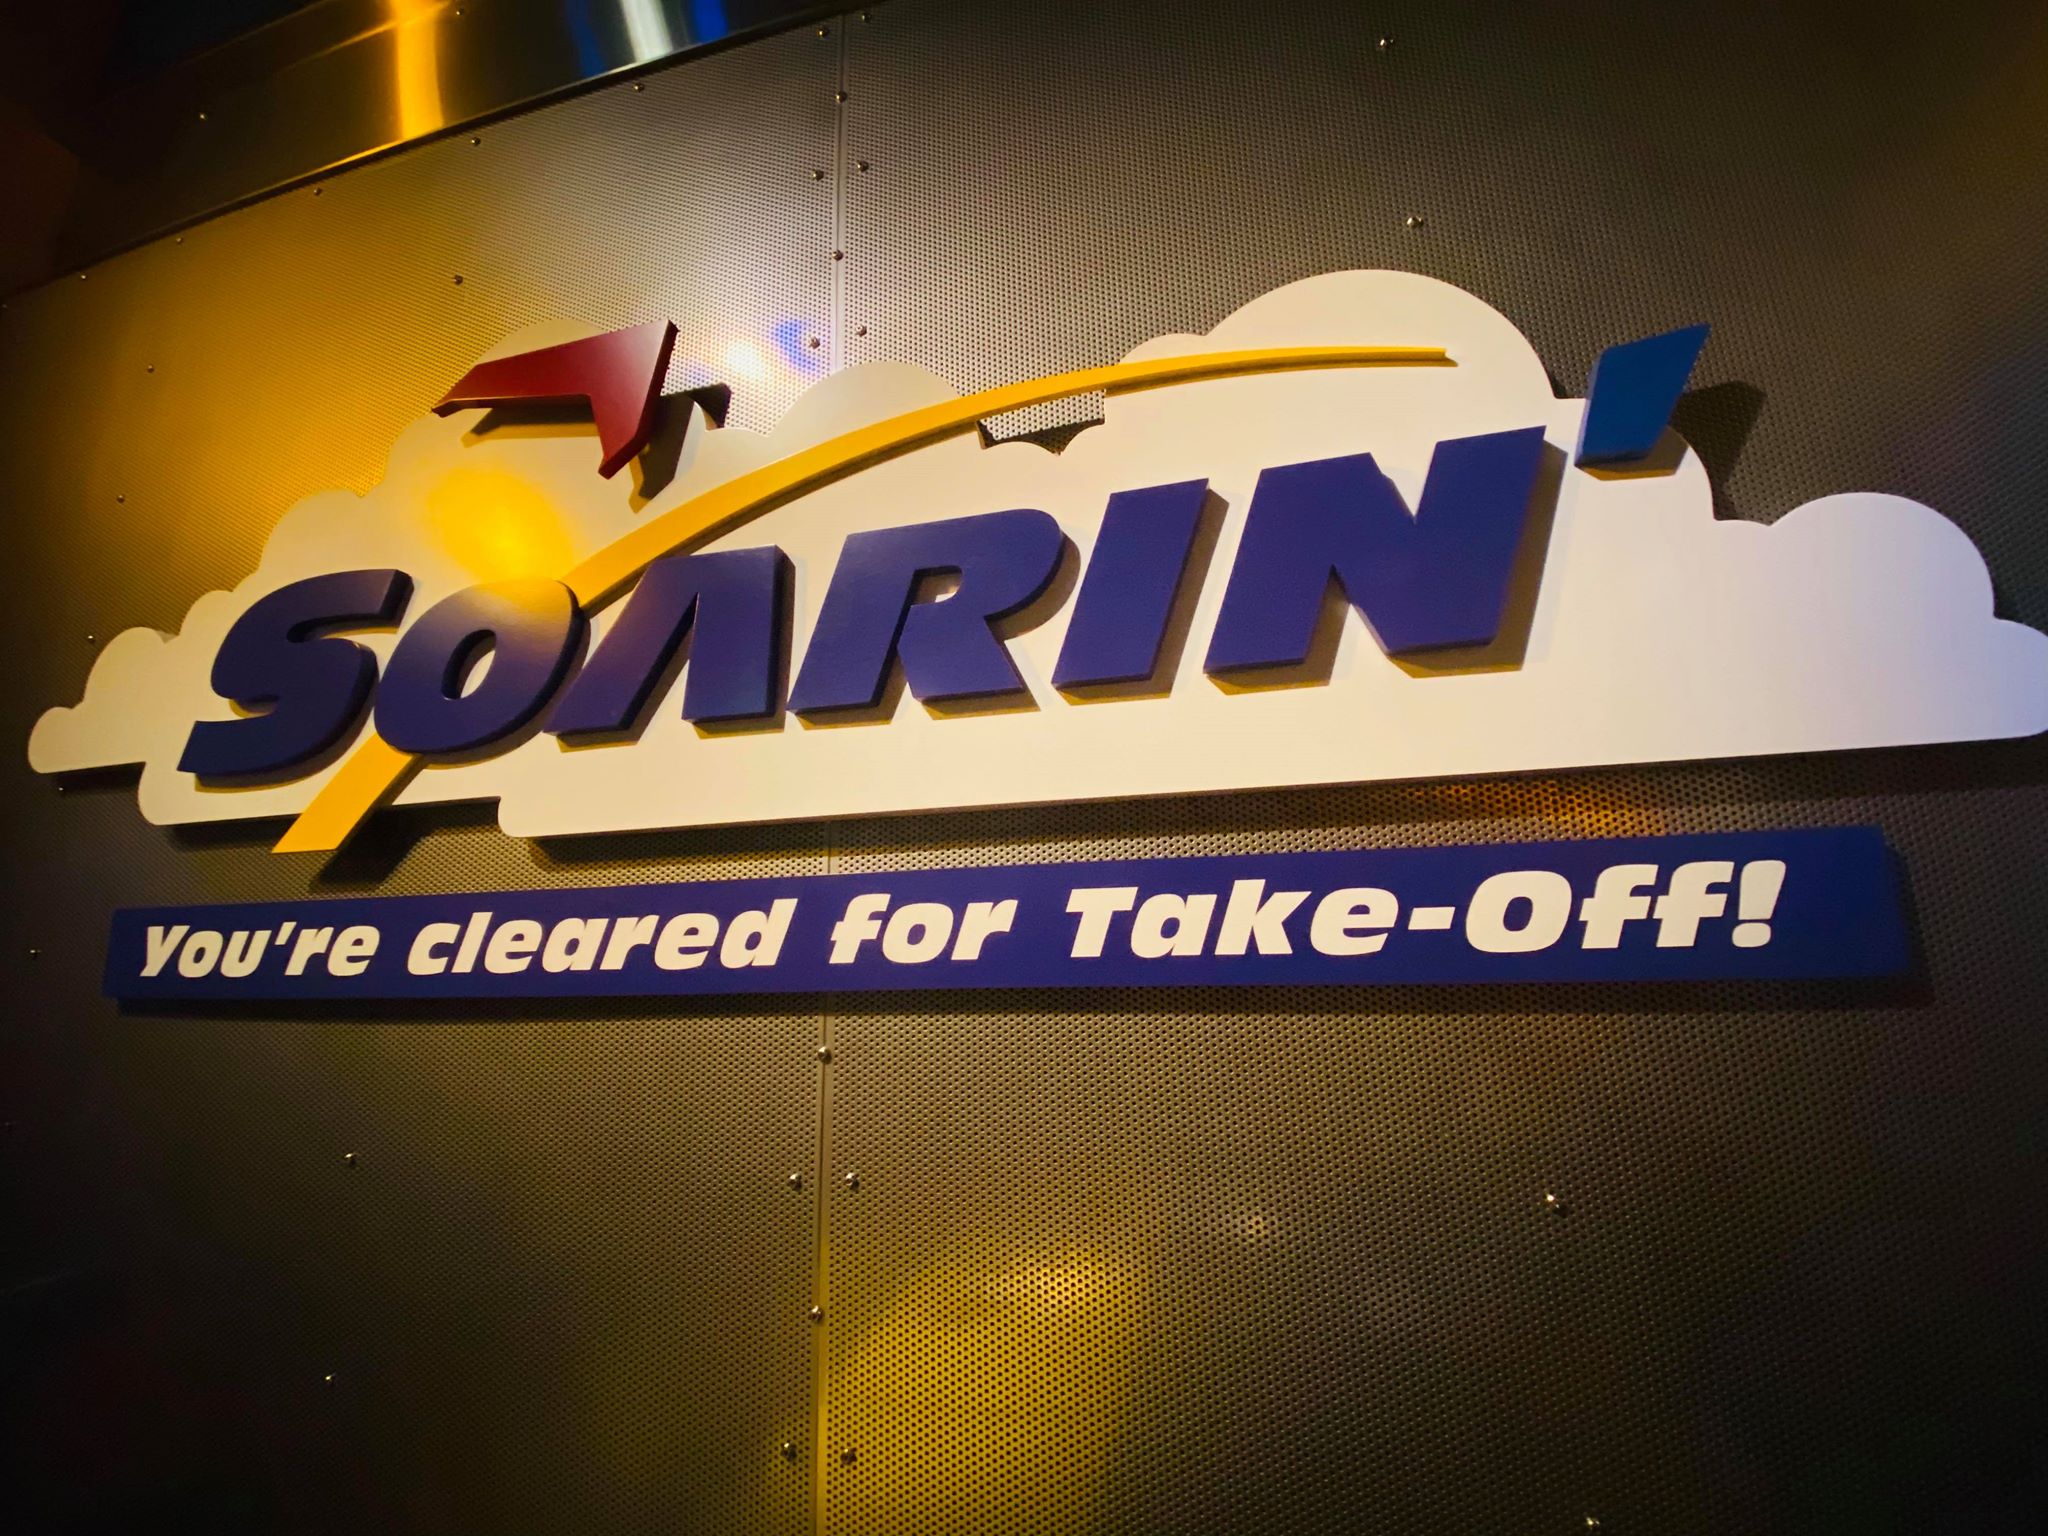
This park has mostly returned to pre-pandemic behavior. The top three rides are once again Test Track, Frozen Ever After, and Soarin’.
As usual, Test Track required the longest wait at 75 minutes, down eight minutes from the previous week.
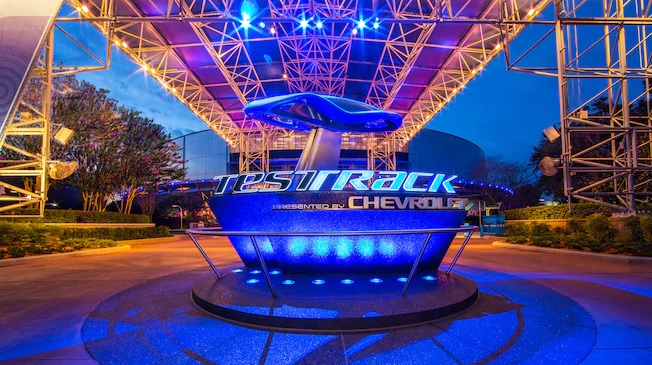
Photo: Disney
Frozen Ever After increased modestly from 52 to 55 minutes, while Soarin’ also went up from 46 to 48 minutes.
So, the three rides came with a slightly reduced wait, although two-thirds of them went up. Test Track really is blowing the curve here on wait times.
Here are the other attractions:
- Mission: SPACE (32 minutes, down four)
- Gran Fiesta Tour Starring the Three Caballeros (28 minutes, up seven)
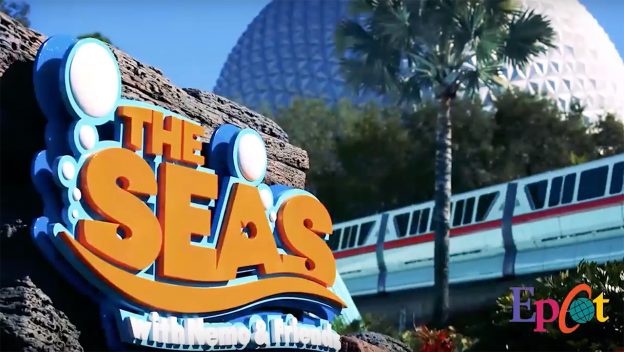
- The Seas with Nemo & Friends (20 minutes, up two)
- Spaceship Earth (20 minutes, no change)
- Journey into Imagination with Figment (14 minutes, down three)
- Living with the Land (12 minutes, down five)
Overall, the average EPCOT attraction came with a wait of 32 minutes, down a minute from last week.
Magic Kingdom
Like EPCOT, Magic Kingdom has circled back to early 2020 behavior. The wait times reveal relatively static behavior across the park:
- Seven Dwarfs Mine Train (65 minutes, up 10)
- Splash Mountain (51 minutes, down five)
- Jungle Cruise (48 minutes, down two)
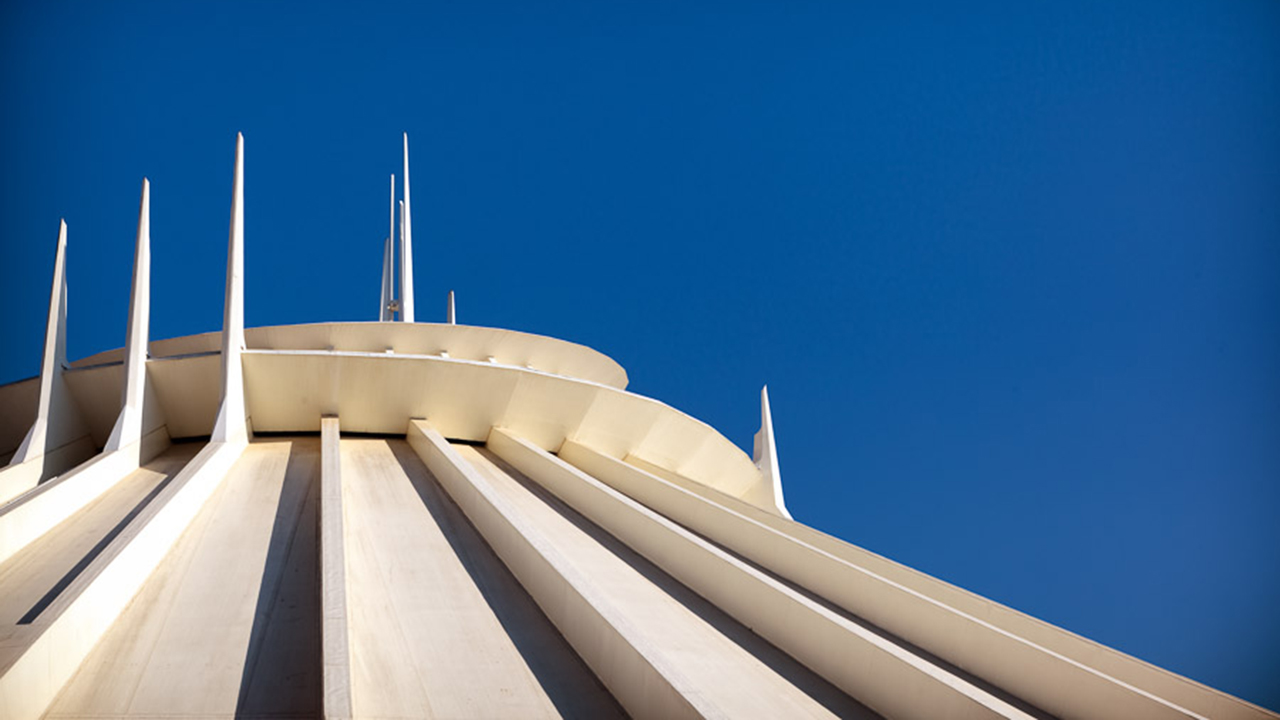
- Space Mountain (40 minutes, down two)
- Peter Pan’s Flight (39 minutes, down three)
- Haunted Mansion (38 minutes, up 10)
- Astro Orbiter (34 minutes, down four)
- The Many Adventures of Winnie the Pooh (28 minutes, down four)
- Big Thunder Mountain Railroad (28 minutes, down seven)
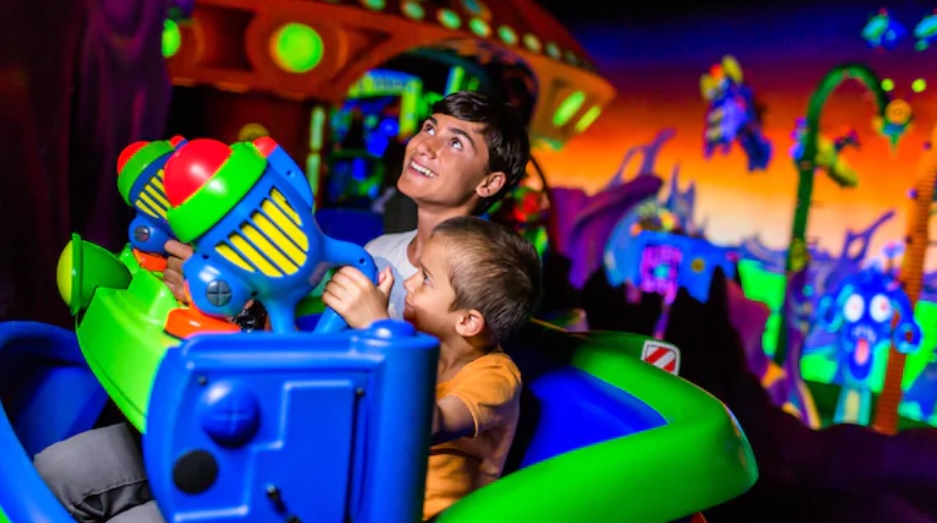
- Buzz Lightyear’s Space Ranger Spin (27 minutes, no change)
- Pirates of the Caribbean (26 minutes, down nine)
- It’s a Small World (23 minutes, down four)
- Under the Sea ~ Journey of the Little Mermaid (20 minutes, down one)
- Tomorrowland Transit Authority PeopleMover (15 minutes, no change)
- Dumbo the Flying Elephant (15 minutes, down two)
- Tomorrowland Speedway (13 minutes, down two)
- Magic Carpets of Aladdin (12 minutes, down two)
- The Barnstormer (12 minutes, down one)
- Mad Tea Party (12 minutes, down three)
- Mickey’s PhilharMagic (11 minutes, down six)
- Prince Charming Regal Carrousel (10 minutes, down five)
- Country Bear Jamboree (eight minutes, down one)
- Walt Disney’s Carousel of Progress (five minutes, no change)
The average Magic Kingdom ride required a wait of 25 minutes, down two minutes from last week.
So, I think it’s fair to expect these wait times to remain static, give or take a bit, until Disney increases capacity again.
Some insiders have speculated that Disney operates at 60 percent right now, although executives aren’t commenting.
I presume the only significant change would come if/when Disney does something with FastPasses.
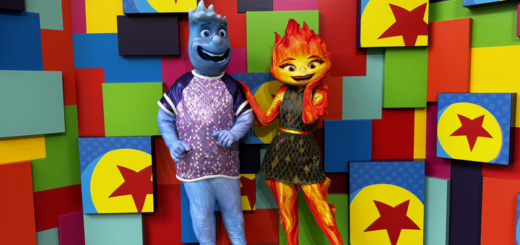
Disney California Adventure
This week, we’ll discuss Disneyland Resort again to provide some perspective about the impact of Avengers Campus.
Please remember that the parks only reopened on April 30th, meaning we’re only six/seven weeks into its return. That skews the data some.
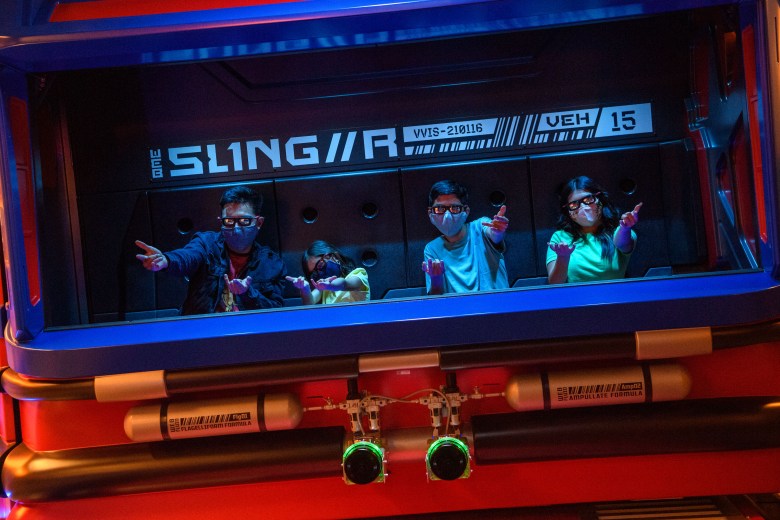
Photo: Disney
However, there’s no skewing WEBSLINGERS: A Spider-Man Adventure, which came with a wait of 206 minutes.
Yes, you could have watched Avengers: Endgame on your smartphone while waiting in line for this ride.
Source: Marvel.com
Obviously, that number is up from last week, when it averaged 168 minutes. What’re another 38 minutes for Marvel fans?
Here are the other, less shocking wait times:
- Radiator Springs Racers (62 minutes, down six)
- Toy Story Midway Mania! (42 minutes, no change)
- Guardians of the Galaxy – Mission: BREAKOUT! (35 minutes, down two)
- Grizzly River Run (32 minutes, down 24)
- Soarin’ Around the World (30 minutes, down 10)
- Pixar Pal-A-Round (29 minutes, no change)
- Luigi’s Rollickin’ Roadsters (28 minutes, up six)
- Goofy’s Sky School (26 minutes, down one)
- Monsters, Inc. Mike & Sulley to the Rescue! (22 minutes, down two)
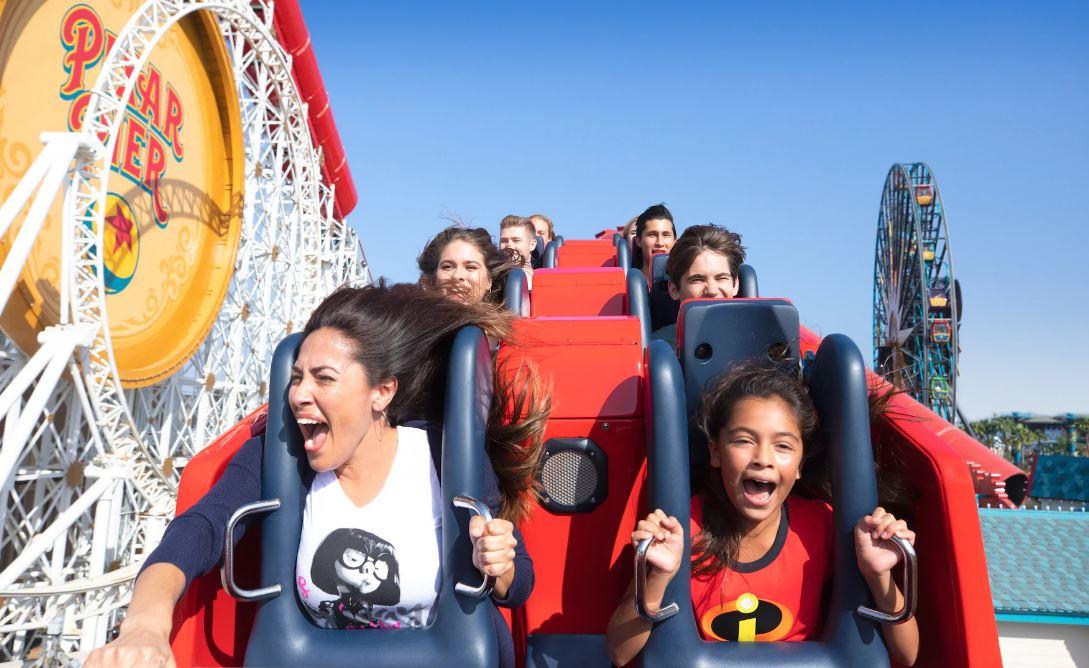
- Incredicoaster (19 minutes, down four)
- Inside Out Emotional Whirlwind (16 minutes, no change)
- Jumpin’ Jellyfish (14 minutes, down one)
- Silly Symphony Swings (10 minutes, down five)
- The Little Mermaid ~ Ariel’s Undersea Adventure (10 minutes, down six)
- Mater’s Junkyard Jamboree (10 minutes, down three)
- Golden Zephyr (eight minutes, up five)
- Jessie’s Critter Carousel (five minutes, no change)
So, I think these wait times suggest that the park is experiencing increased traffic. However, the guests mainly keep to the areas in/near Avengers Campus.
To wit, the average wait time decreased four minutes to 24 minutes despite the massive spike for the new Spider-Man attraction.
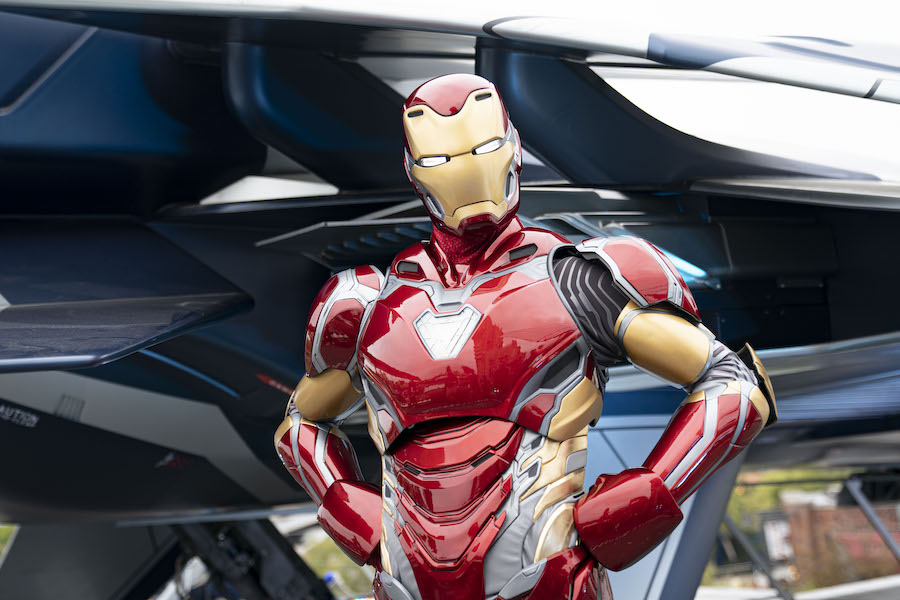
Image Credit: Ty Popko/Disneyland Resort
Of course, there’s good and bad news there. This information indicates that most park guests don’t get to ride that one.
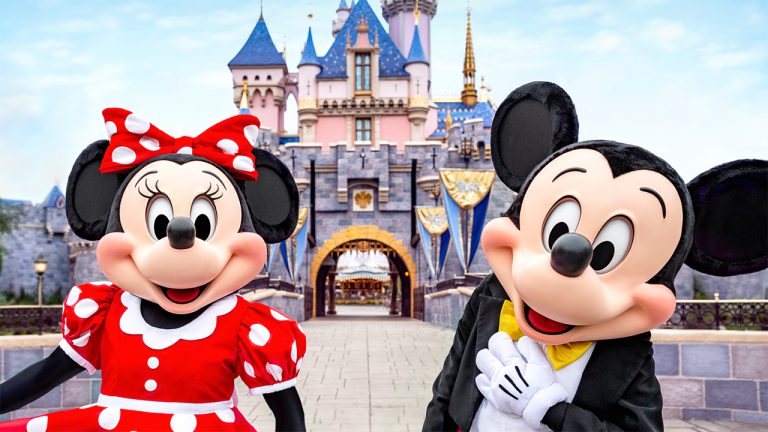
Disneyland
Finally, here’s the essential wait time data for the Happiest Place on Earth:
- Splash Mountain (41 minutes, down eight)
- Indiana Jones Adventure (35 minutes, up seven)
- Millennium Falcon: Smugglers Run (34 minutes, down seven)
- Space Mountain (34 minutes, down eight)
- Snow White’s Enchanted Wish (27 minutes, down one)
- Roger Rabbit’s Car Toon Spin (22 minutes, up six)
- Astro Orbiter (20 minutes, up two)
- Toad’s Wild Ride (16 minutes, down two)
- Autopia (16 minutes, down one)
- Disneyland Railroad (15 minutes, down ten)
- Pinocchio’s Daring Journey (14 minutes, up three)
- Gadget’s Go Coaster (12 minutes, no change)
- King Arthur’s Carrousel (11 minutes, down four)
- Casey Jr. Circus Train (11 minutes, up one)
- It’s a Small World (seven minutes, down six)
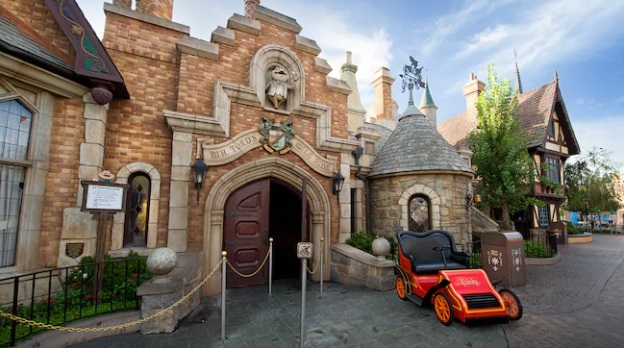
Photo: RetroWDW.com
At Disneyland, guests waited for an average of 20 minutes for an attraction, which is phenomenal. It’s also down four minutes from last week.
Overall, Disney theme parks are holding steady as guests rush back to the parks, which is impressive.