Disney Wait Times for the Second Week of June 2021
Okay, we’re officially in summer now. While Disney theme parks technically didn’t enter summer yet last week, they were close enough.
Plus, with the pandemic mainly in the rearview mirror, tourists rushed to parks. So, I’m going to do something different this week.
Here are the Disney wait times for ALL American parks for the second week of June.
We will compare them next week to check whether out-of-state guests spike traffic at Disneyland.
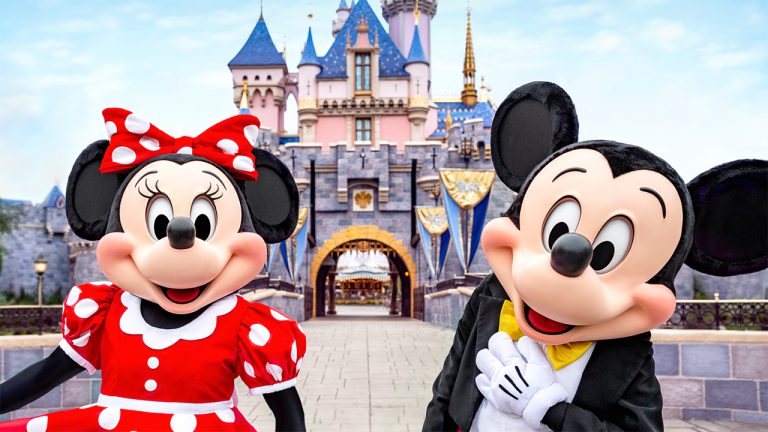
Photo: Disney
Disney’s Animal Kingdom
Here are the average wait times for last week at Animal Kingdom. I’ll provide commentary afterward.
- Avatar Flight of Passage – 74 minutes, up eight minutes
- Na’Vi River Journey – 41 minutes, up one minute
- Kilimanjaro Safaris – 40 minutes, up ten minutes
- Kali River Rapids – 30 minutes, up three minutes
- Expedition Everest – 28 minutes, up six minutes
- DINOSAUR – 26 minutes, up three minutes
- It’s Tough to Be a Bug! – 15 minutes, up two minutes
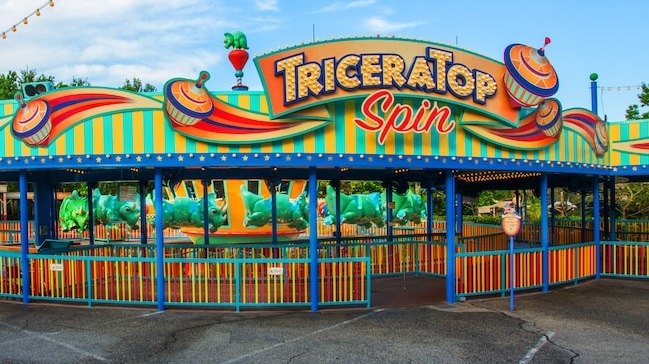
- TriceraTop Spin – 6 minutes, no change
Okay, you can already tell that traffic has increased significantly at the park. Every attraction increased in wait time other than TriceraTop Spin, which remained the same.
Overall, the average attraction wait time went up from 31 to 35 minutes. That may not sound like much, but it’s a 13 percent increase.
The explanations stem from the top, as two of the top three rides increased by 18 total minutes. Expedition Everest came with much longer lines, too.
So, the early trend here is that Walt Disney World waits are getting worse. We’ll verify that with the other three parks.
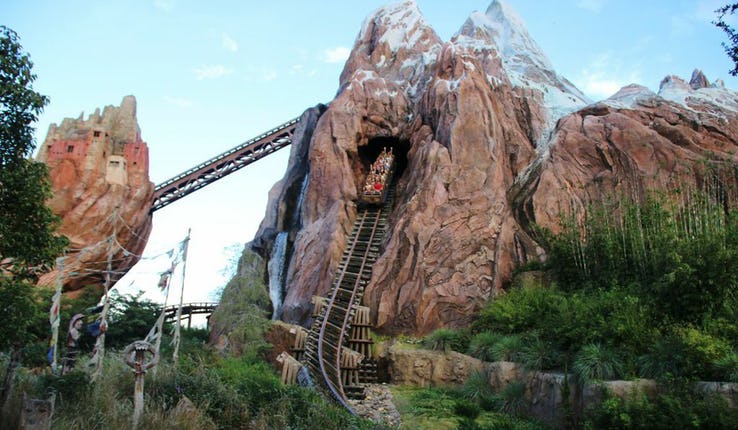
Photo: Disney
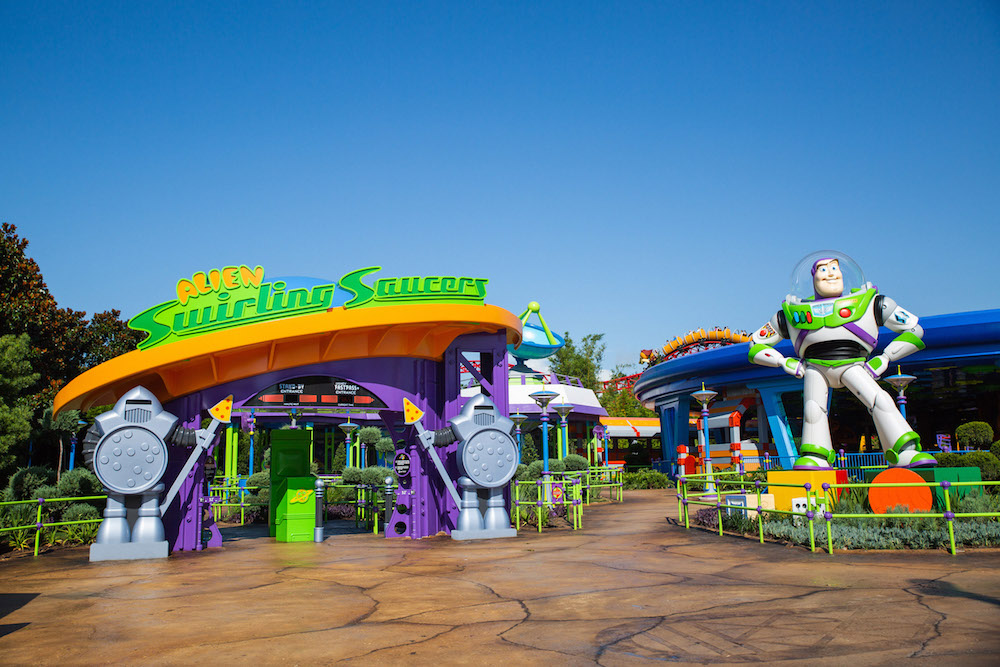
Disney’s Hollywood Studios
As a reminder, Hollywood Studios is usually the worst of the Walt Disney World parks with regards to wait time, especially at the top.
Slinky Dog Dash is consistently the longest line on the Disney campus. Did that change this week? No.
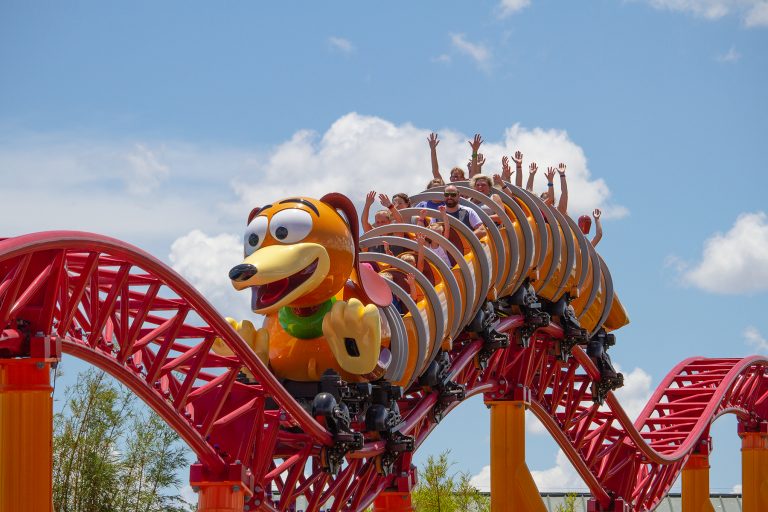
Photo: thecoasterkings.com
This adorable roller coaster’s wait increased from 69 to 79 minutes, a stiff uptick. Was that the case for the other attractions? Let’s look:
- Millennium Falcon: Smugglers Run – 52 minutes, down two minutes
- Rock ‘n’ Roller Coaster Starring Aerosmith – 49 minutes, up four minutes
- Mickey & Minnie’s Runaway Railway – 45 minutes, up three minutes
- Toy Story Mania! – 40 minutes, up seven minutes
- Twilight Zone Tower of Terror – 32 minutes, up three minutes
- Lightning McQueen’s Racing Academy – 11 minutes, down ten minutes
- Alien Swirling Saucers – 28 minutes, up eight minutes
- Star Tours – The Adventures Continue – 14 minutes, down three minutes
- Muppet*Vision – 12 minutes, up two minutes
Steven Diaz, photographer
The average Hollywood Studios attraction required a wait of 31 minutes, and it generally held this week at 32 minutes.
So, Hollywood Studios didn’t experience the same surge as Animal Kingdom. That’s important because we know Animal Kingdom had power outages twice.
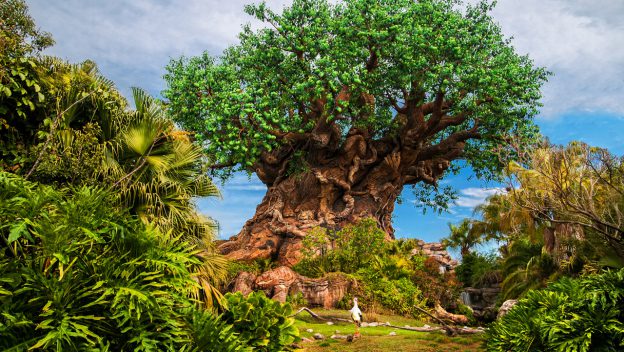
Photo: Disney
Did those fluke events impact overall wait times? It’s definitely possible. Let’s take a look at the other two Disney parks before deciding.
EPCOT
Whoops, did I say that Slinky Dog Dash had the longest wait? I spoke too soon. Test Track done lost its darn mind!
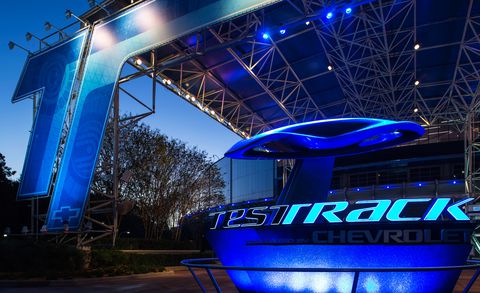
The wait time surged from 60 minutes to 83 (!) minutes. That’s a 38 percent increase week over week, which is highly unusual.
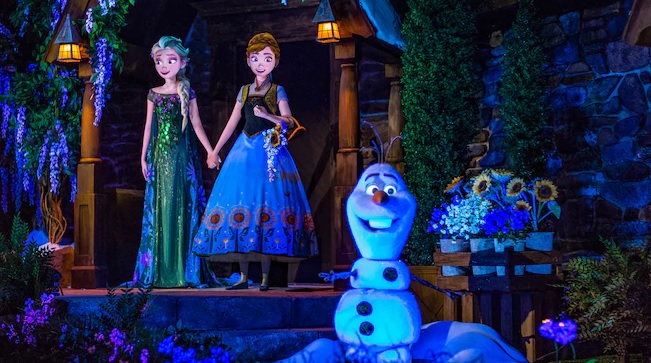
Did the other top rides at EPCOT experience similar behavior? Not really. Frozen Ever After modestly bumped up from 49 to 52 minutes.
Meanwhile, Soarin’ Around the World actually went down from 52 to 46 minutes. Mission: SPACE similarly plummeted from 50 to 36 minutes.
I presume this change stems from boarding procedure changes as Disney resets to its pre-pandemic policies.
Oddly, this change didn’t impact the Green version as much. It fell from 17 to 12 minutes.
Here are the other, less crowded rides at EPCOT:
- Gran Fiesta Tour Starring the Three Caballeros – 21 minutes, up six minutes
- Spaceship Earth – 20 minutes, up two minutes
- The Seas with Nemo & Friends – 18 minutes, no change
- Living with the Land – 17 minutes, up two minutes
- Journey into Imagination with Figment – 17 minutes, no change
Overall, the average EPCOT attraction came with a wait of 33 minutes, the same as last week.
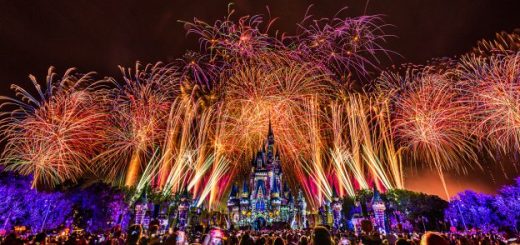
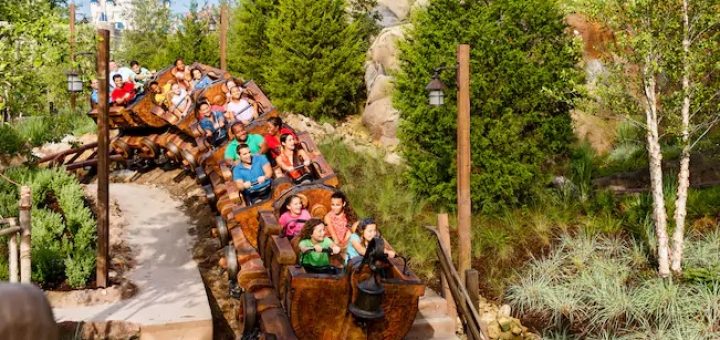
Magic Kingdom
Okay, we’ve got one final test to tell whether Animal Kingdom was a fluke. Here are the wait times at Magic Kingdom for last week:
- Splash Mountain – 56 minutes, down four minutes
- Seven Dwarfs Mine Train – 55 minutes, no change
- Jungle Cruise – 50 minutes, down eight minutes
- Space Mountain – 42 minutes, no change
- Peter Pan’s Flight – 42 minutes, up three minutes
- Astro Orbiter – 38 minutes, up four minutes
- Pirates of the Caribbean – 35 minutes, down five minutes
- Big Thunder Mountain Railroad – 35 minutes, up ten minutes
- The Many Adventures of Winnie the Pooh – 32 minutes, up three minutes
- Haunted Mansion – 28 minutes, up six minutes
- Buzz Lightyear’s Space Ranger Spin – 27 minutes, up two minutes
- It’s a Small World – 27 minutes, down three minutes
- Under the Sea ~ Voyage of the Little Mermaid – 21 minutes, up three minutes
- Dumbo the Flying Elephant – 17 minutes, up four minutes
- Mickey’s PhilharMagic – 17 minutes, up three minutes
- Tomorrowland Speedway – 15 minutes, up four minutes
- Tomorrowland Transit Authority PeopleMover – 15 minutes, no change
- Mad Tea Party – 15 minutes, down one minute
- Prince Charming Regal Carrousel – 15 minutes, down three minutes
- Magic Carpets of Aladdin – 14 minutes, up three minutes
- The Barnstormer – 13 minutes, up one minute
- Country Bear Jamboree – nine minutes, up three minutes
- Walt Disney’s Carousel of Progress – five minutes, down one minute
Overall, the average Magic Kingdom attraction required a wait of 27 minutes, up one minute.
So, I think it’s fair to state that Animal Kingdom’s behavior proved anomalous due to the two massive power outages.
Image Credit: Disney
Overall, Disney crowds increased slightly but not significantly. What about Disneyland? Well…
Disney California Adventure
The data point that matters the most is that the average Disney California Adventure attraction came with a wait of 28 minutes.
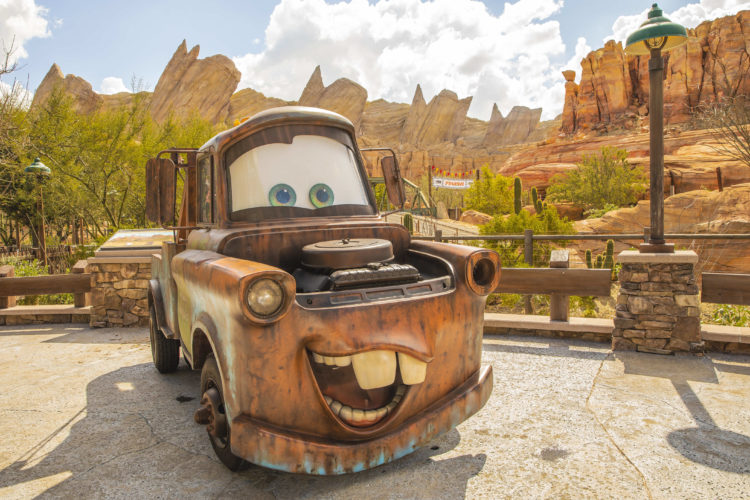
(Christian Thompson/Disneyland Resort)
That’s higher than usual, and you can guess the culprit. Here’s a quick look at the most popular rides:
- WEB SLINGERS: A Spider-Man Adventure – 168 minutes
- Radiator Springs Racers – 68 minutes
- Grizzly River Run – 56 minutes
- Toy Story Midway Mania! – 42 minutes
- Soarin’ Around the World – 40 minutes
- Guardians of the Galaxy – Mission: BREAKOUT! – 37 minutes
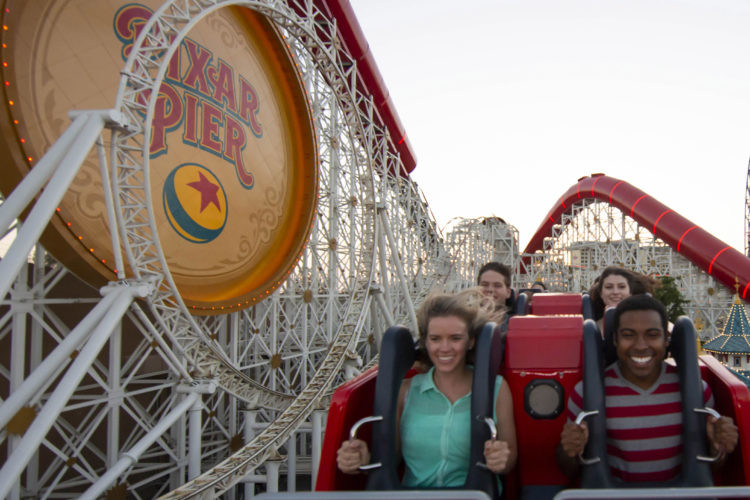
- Pixar Pal-A-Round – 29 minutes
- Goofy’s Sky School – 27 minutes
- Monsters, Inc. Mike & Sulley to the Rescue! – 24 minutes
- The Incredicoaster – 23 minutes
- Luigi’s Rollickin’ Roadsters – 22 minutes
- Inside Out Emotional Whirlwind – 16 minutes
- The Little Mermaid – Ariel’s Undersea Adventure – 16 minutes
- Silly Symphony Swings – 15 minutes
- Jumpin’ Jellyfish – 15 minutes
- Mater’s Junkyard Jamboree – 13 minutes
- Jessie’s Critter Carousel – five minutes
- Golden Zephyr – three minutes
Credit: Disney
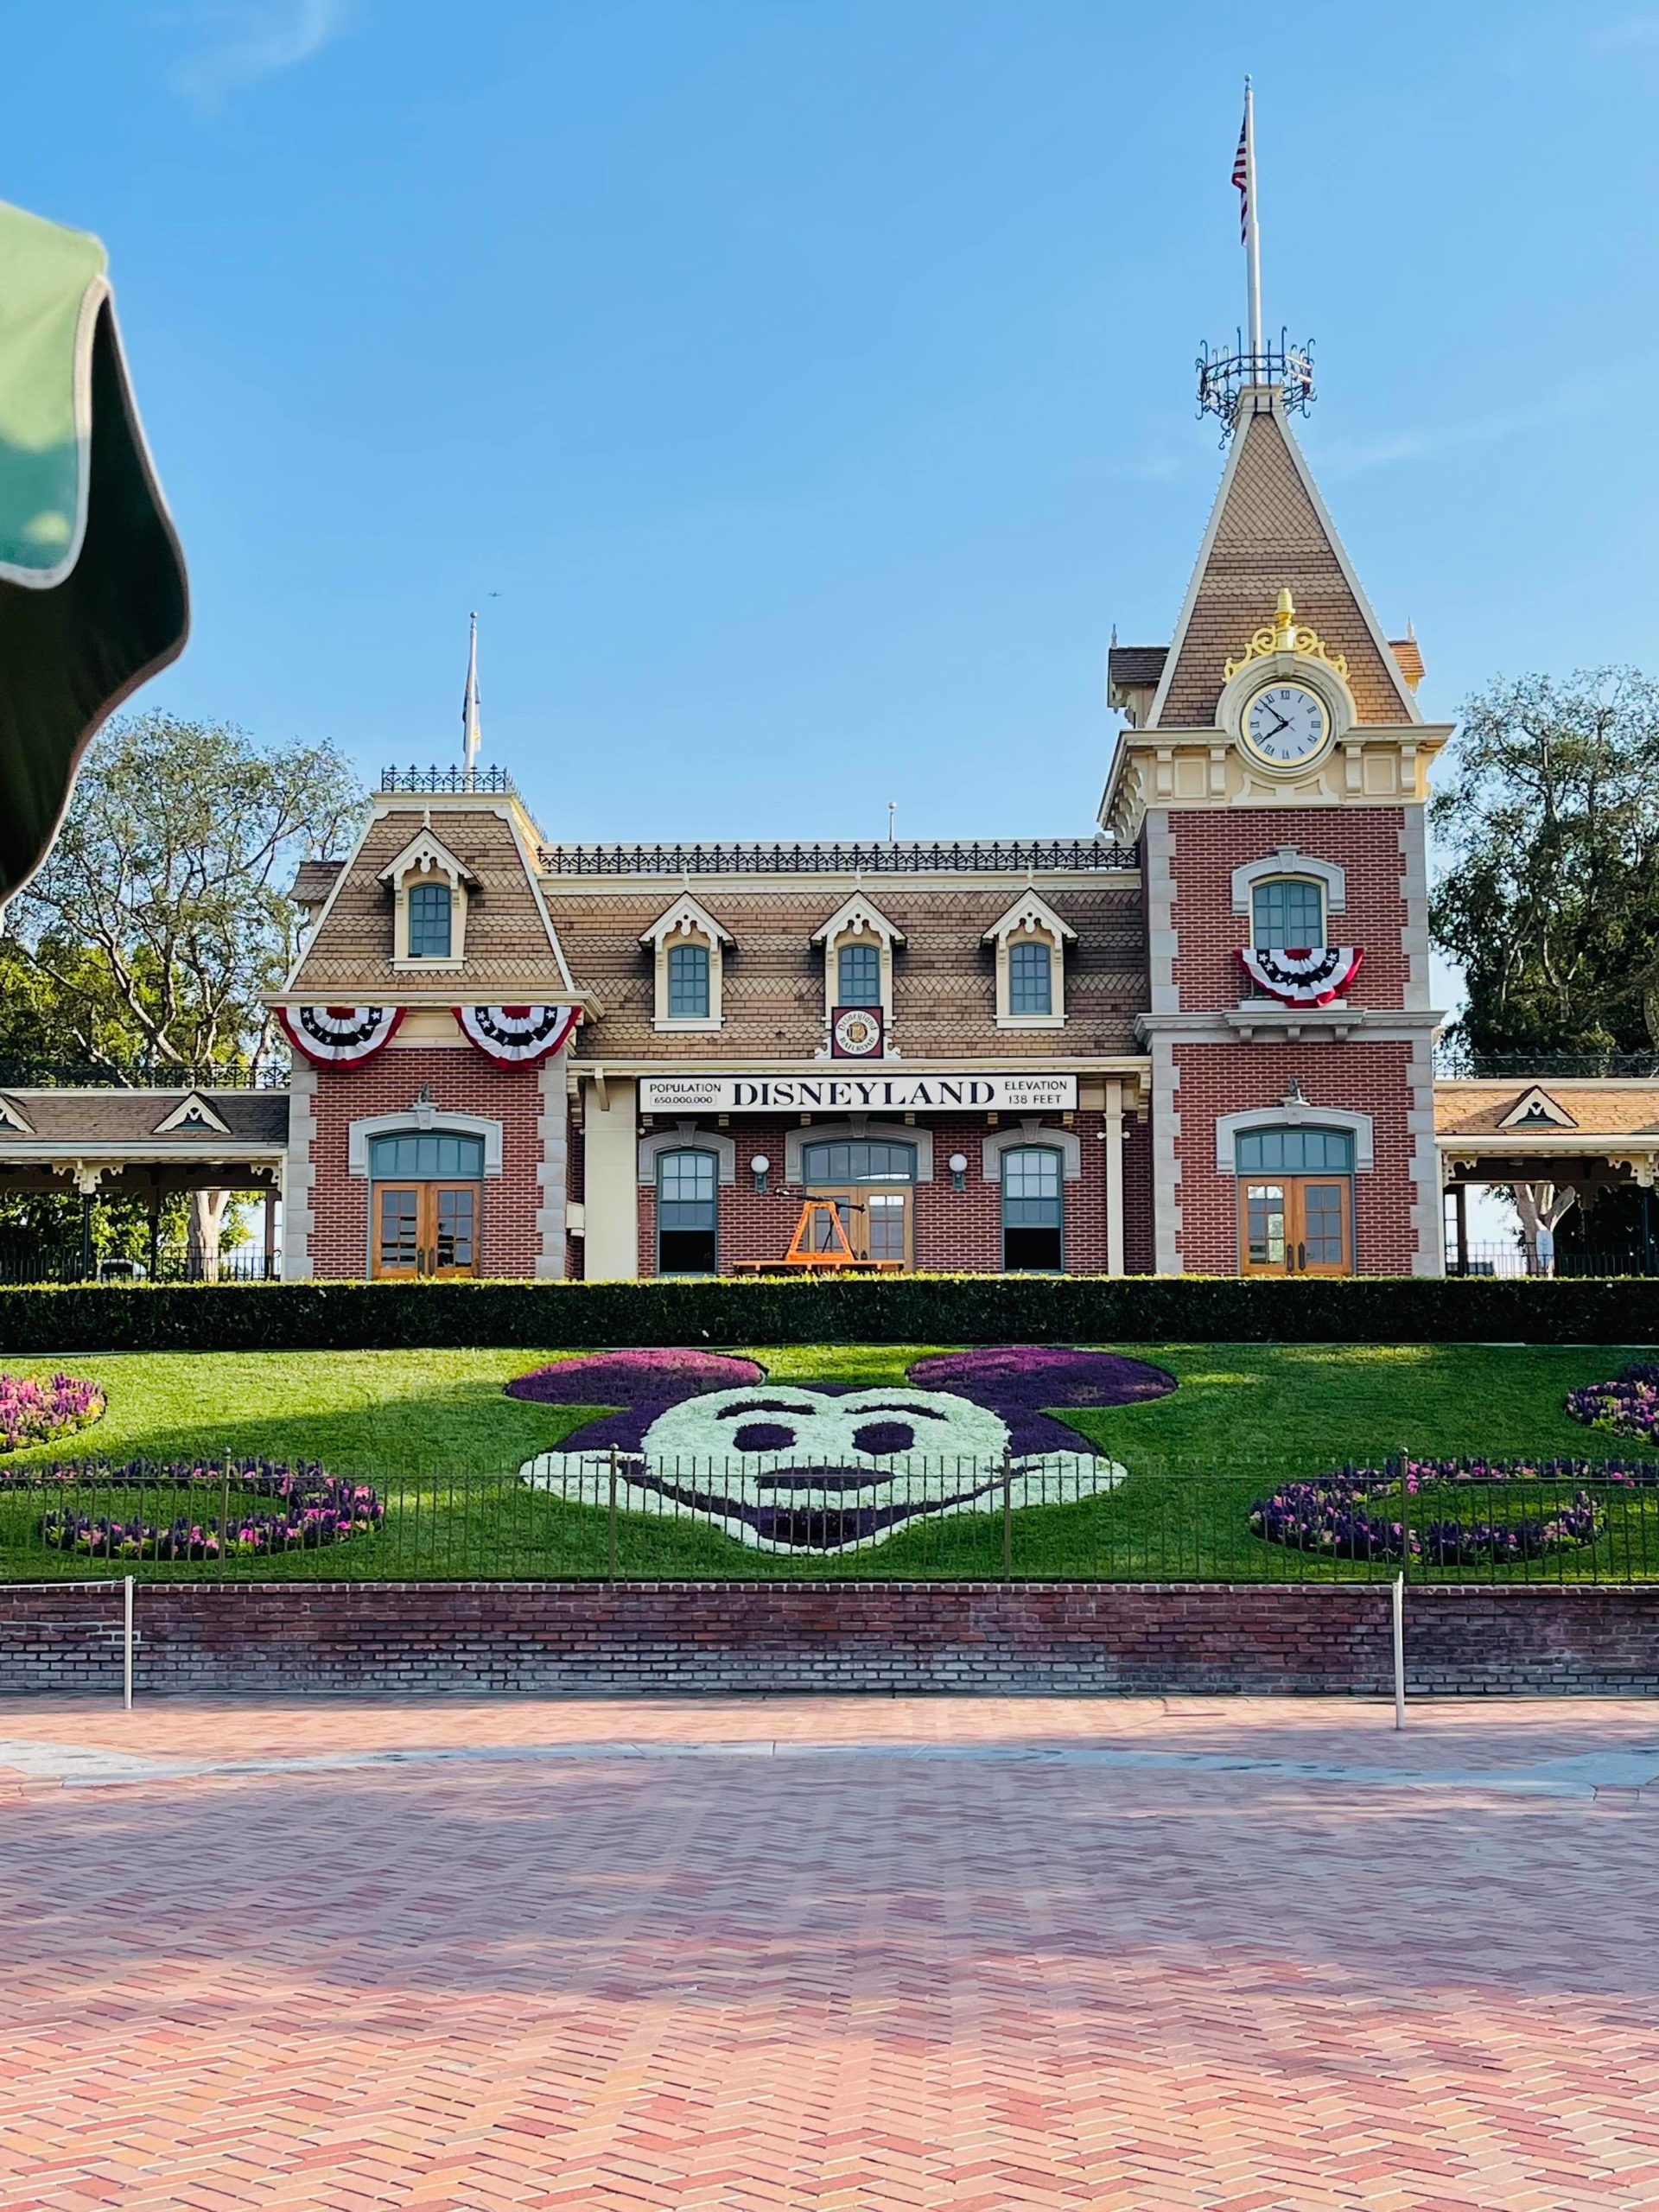
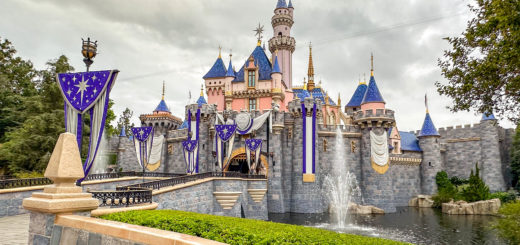
Disneyland
We will only pick a handful of rides at each park to reduce feelings of data overload.
Disneyland currently hosts three attractions with the longest waits. Those are:
- Splash Mountain (49 minutes)
- Space Mountain (42 minutes)
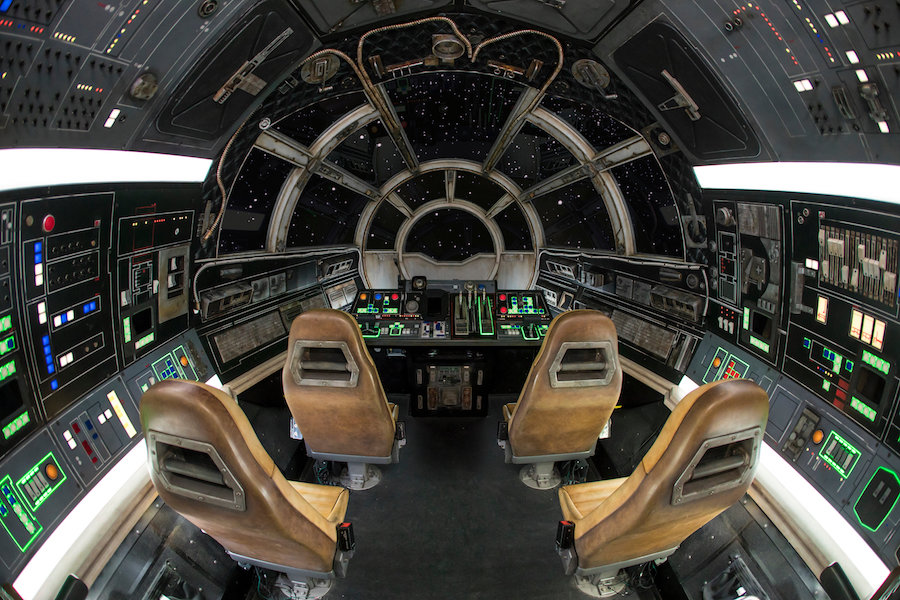
- Millennium Falcon: Smuggler’s Run (41 minutes)
You can already tell that this park works similarly to Magic Kingdom. The sheer volume of attractions ensures that the waits are relatively reasonable.
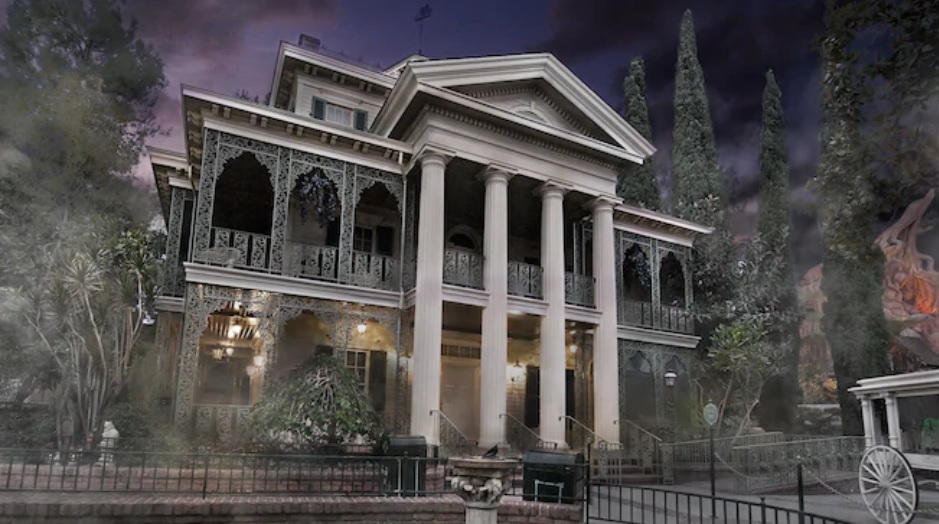
In fact, most rides with name recognition hover around 30 minutes, which was true last week. I mean Haunted Mansion, Pirates of the Caribbean, and the like.
Disneyland does host two unique attractions, Indiana Jones Adventure and the new Snow White’s Enchanted Wish. Their waits were 28 minutes each.
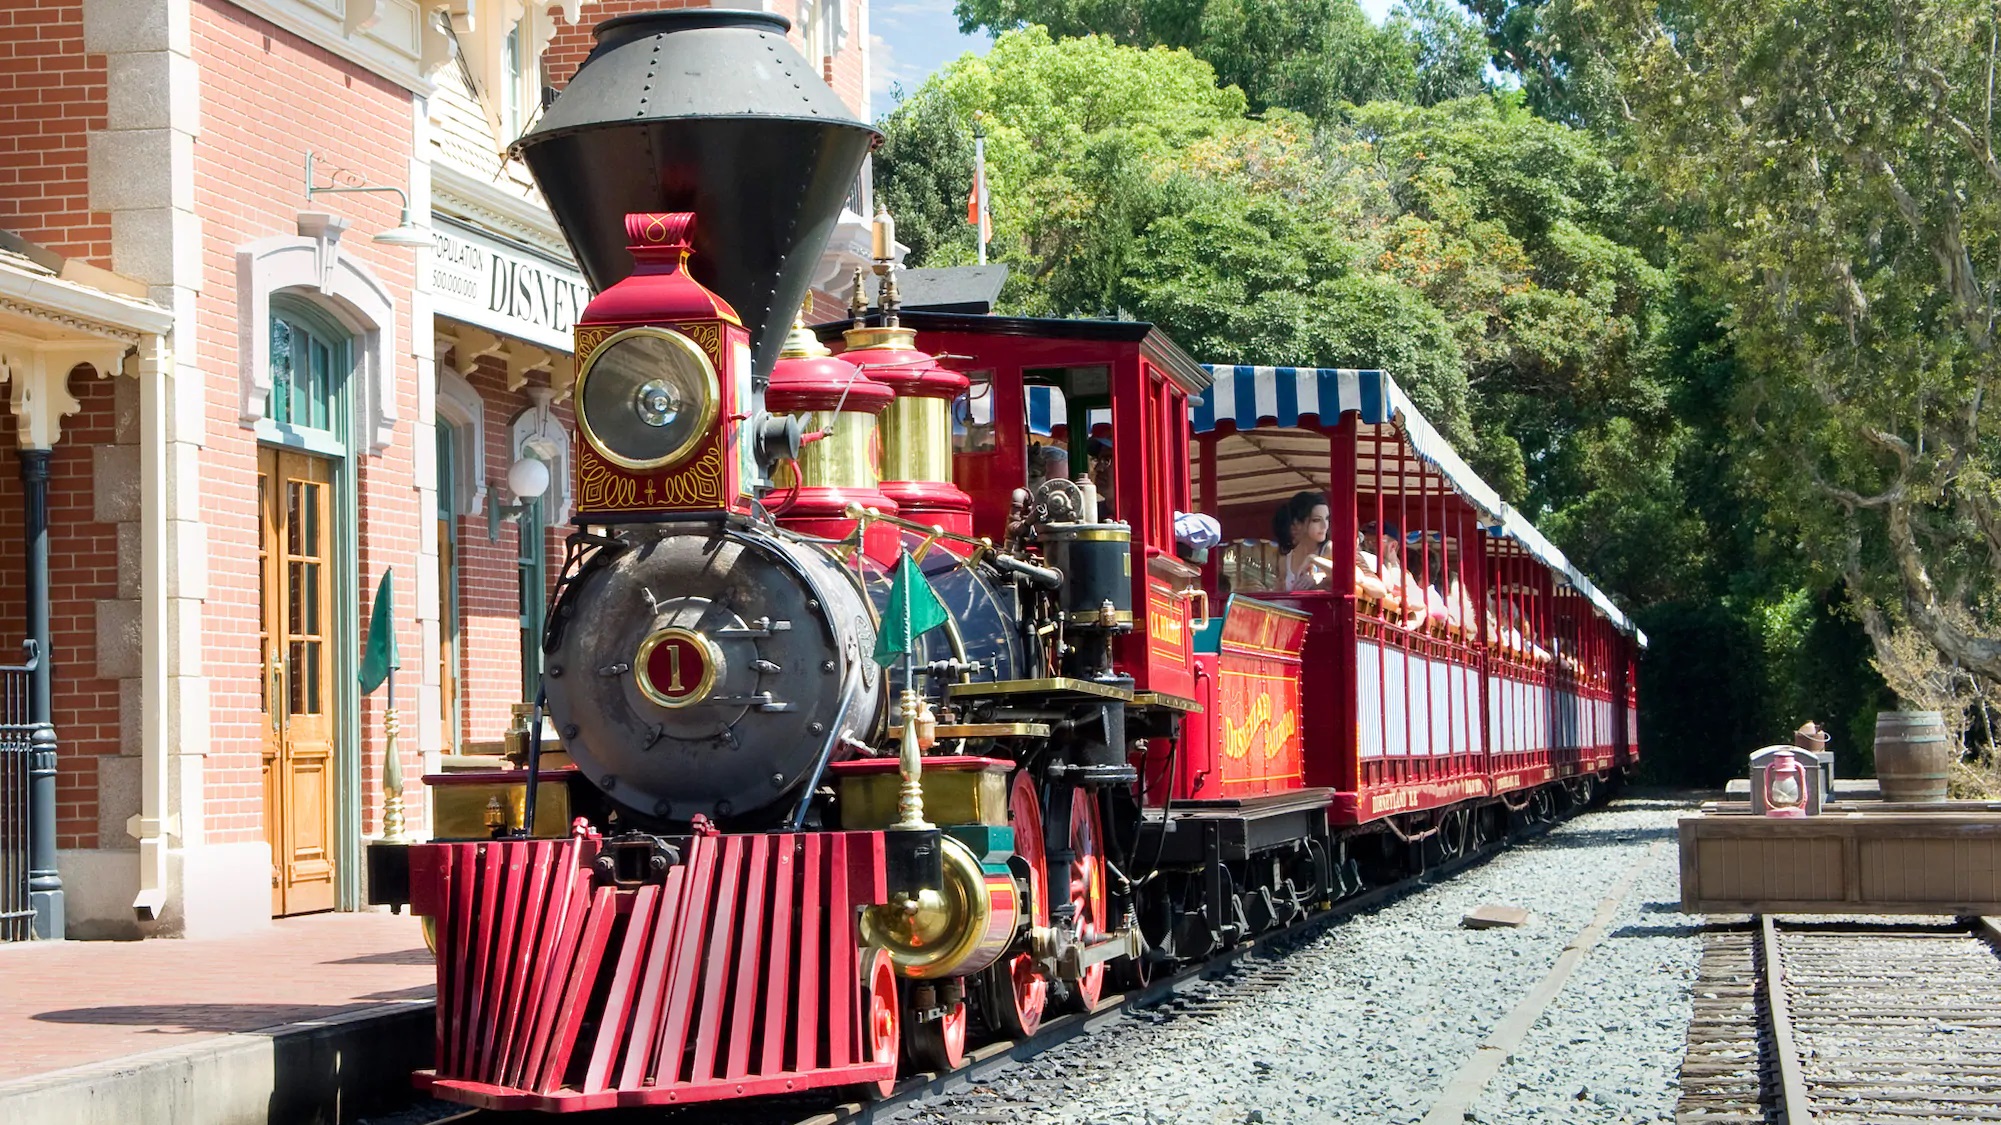
Perhaps the unexpected outlier is Disneyland Railroad, which averages a 25-minute wait.
Beyond that, some of the unique Disneyland attractions feature waits of 20 minutes or less. Here are a few examples:
- Astro Orbiter – 18 minutes
- Toad’s Wild Ride – 18 minutes
- Autopia – 17 minutes
- Roger Rabbit’s Car Toon Spin – 16 minutes
- King Arthur Carrousel – 15 minutes
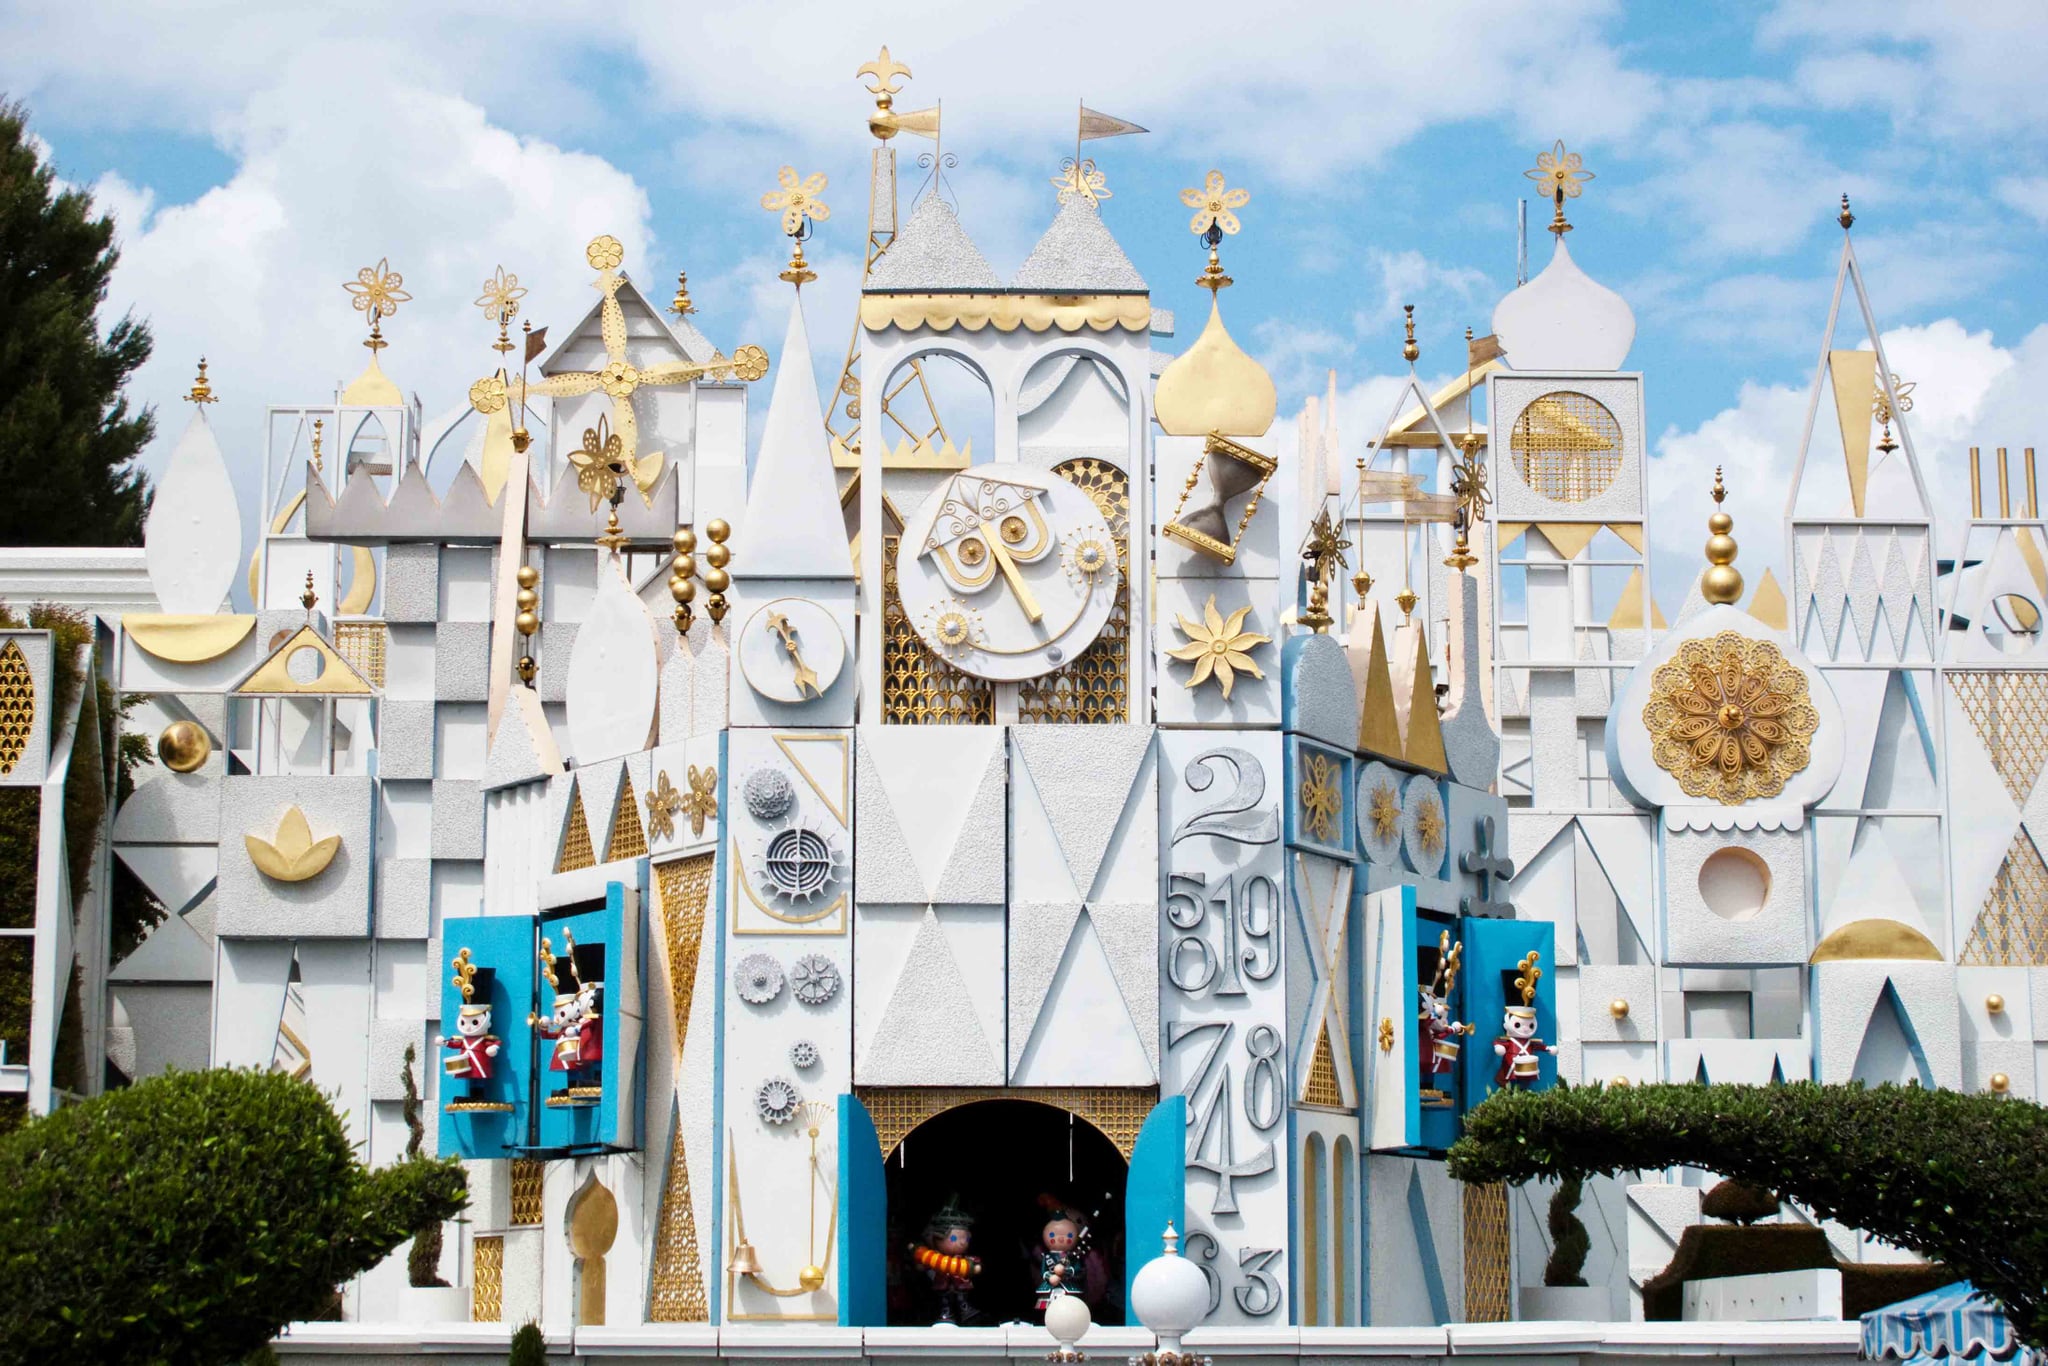
- It’s a Small World – 13 minutes
- Gadget’s Go Coaster – 12 minutes
- Pinocchio’s Daring Journey – 11 minutes
- Casey Jr. Circus Train – 10 minutes
Source: PopSugar
Overall, the average Disneyland attraction features a wait of 24 minutes. If you compare that to the other parks here, you’ll see that’s the lowest total.
Disneyland truly is the Happiest Place on Earth!